 Nexus
NexusGet Nexus on the wall in minutes.
Nexus is a self-hosted, real-time helpdesk wallboard — Zendesk (Support + Talk), Freshdesk, Freshservice, Jira Service Management, HaloPSA, SuperOps, NinjaOne, ConnectWise PSA, Zoho Desk, Help Scout or Front — for wall TVs, desk monitors, phones, the desktop, and inside Zendesk itself. One codebase, every screen you own.
Overview
What is Nexus?
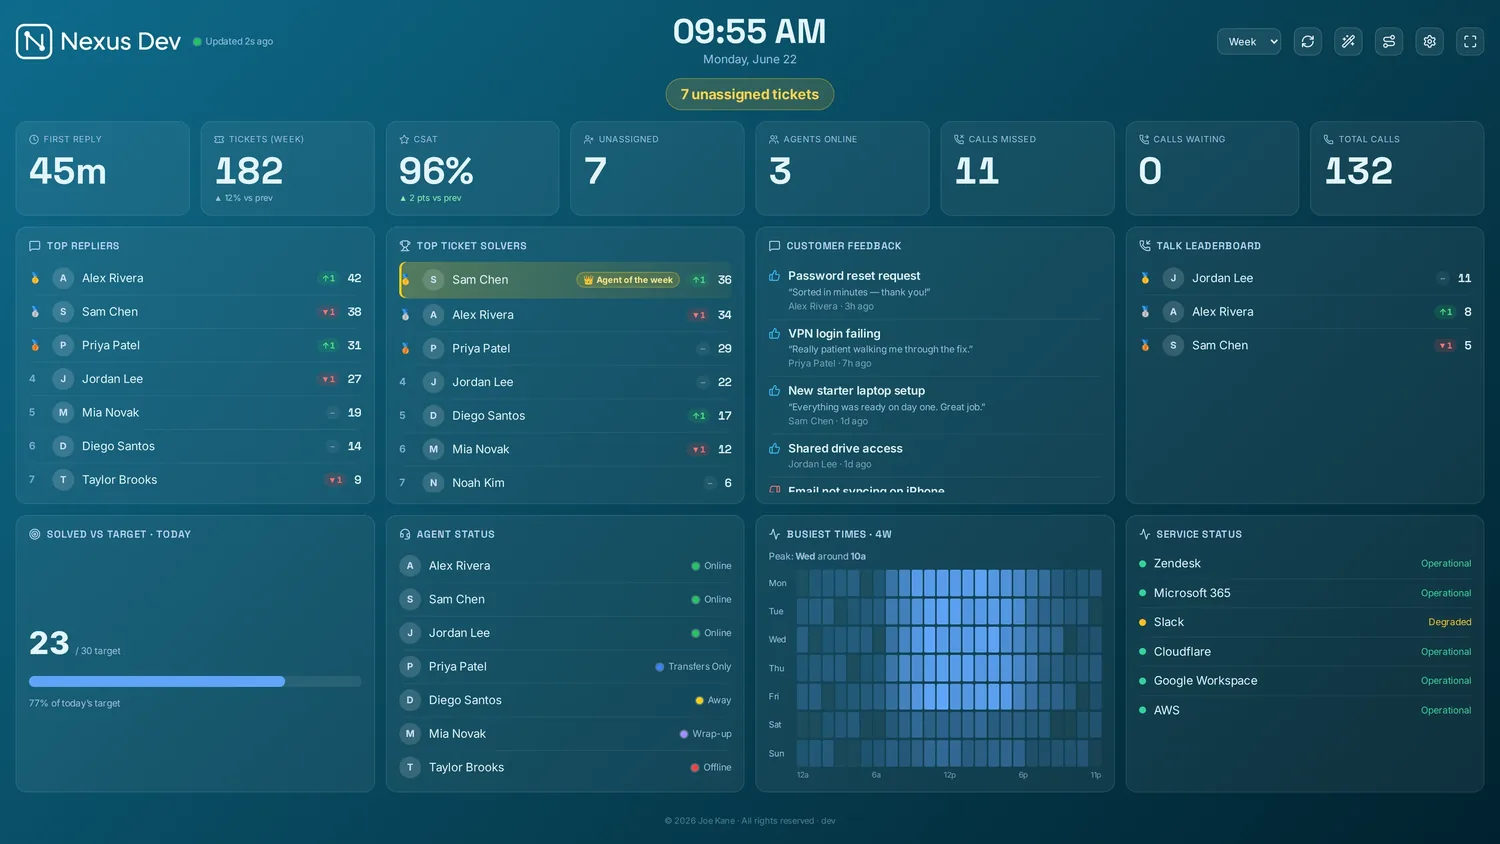
One small server that turns your helpdesk's live data into a board built to live on a wall — KPI tiles, ticket and people panels, leaderboards and trends, refreshing themselves. The desktop, mobile and TV clients are thin shells that all point at that one server.
It's self-hosted: all of your data stays on your server's ./data volume, and the clients are stateless renderers — so updating, replacing or losing a client can never lose anything. Rather not run a server? Managed hosting is an optional add-on — we run your own isolated instance for you, and everything else on this page works the same.
What you get
- Live where it matters. Tiered refresh (20 s live Talk, 60 s tickets, 5-min aggregates), SLA breach countdowns, a war-room takeover, sound alerts and click-to-drill-down.
- Built to motivate. A goal-tracked KPI strip with RAG status, gauges, leaderboard gamification, a team-goal thermometer, and confetti when the team hits its target.
- Answers, not just numbers. Backlog burn-down, a busiest-times heatmap, reopen rate & first-contact resolution, top tags, and persisted history so trends survive restarts.
- Production-minded. First-run setup wizard, OS-native encrypted secrets, an optional admin token, client-scoped access links with server-enforced data isolation, and SSRF-guarded outbound fetches.
Try it free — no account needed
You can have the board running with realistic sample data in about a minute, no account needed, in demo mode. Connecting your real helpdesk — Zendesk, Freshdesk, Freshservice, Jira Service Management, HaloPSA, SuperOps, NinjaOne, ConnectWise PSA, Zoho Desk, Help Scout or Front — needs a licence first, but every plan starts with a 14-day free trial: start the trial (a card holds it — you're only charged if you keep it), paste your activation token into the first-run wizard, then put it on the wall.
In a hurry? Skip setup entirely — demo mode fills the board with realistic sample data in about 30 seconds, no account needed. Toggle it from the first-run wizard.
Get started
Requirements
Nexus is lightweight. A small VPS runs the server comfortably, and the clients are thin shells around the same web board.
The server is a single container (or Node process) that serves the dashboard and its /api on port 3001.
- Host: any Linux VPS, a Docker host, or a desktop OS for local use.
- CPU / RAM: 1 vCPU + 1 GB RAM is plenty (the smallest cloud plan).
- Runtime (Docker): Docker + the Compose plugin — the image bundles Node 26 + a modern glibc.
- Runtime (native): Node 20.x (glibc ≥ 2.28: AlmaLinux/RHEL 8+, Ubuntu 18.10+, Debian 10+).
- Storage: a persistent volume mounted at
/datafor settings, encrypted secrets, layout and history.
On older hosts (CentOS / CloudLinux 7) whose system glibc is too old for Node 18+, use the Docker image — it bundles its own Node 26, so it runs anywhere Docker does.
Clients are thin shells that point at your server URL:
- Desktop — Windows, macOS, Linux (Electron)
- Mobile — iOS & Android (Capacitor) — iOS on the App Store
- Zendesk app — inside Zendesk Support (no server needed)
- Browser — any modern desktop or TV browser pointed at the server URL
The layout is fullscreen-scaling: it fills a 4K wall TV and reflows to a single-column phone. Use a current evergreen browser (Chrome, Edge, Firefox or Safari). Fullscreen is not available inside the Zendesk app — Zendesk disables the Fullscreen API for app iframes.
Network: open ports 80/443 on the host if you're terminating HTTPS at a reverse proxy (recommended). The server reaches your helpdesk and optional integrations outbound; all outbound fetches are SSRF-guarded. Read access is unauthenticated by default — keep the board on a LAN or behind a VPN/SSO/access-controlled proxy.
Quickstart (Docker)
The fastest path is the prebuilt image published to the GitHub Container Registry (GHCR). The source repositories are private, but the image itself is public — that's what you pull to deploy, no GitHub account or credentials needed. Every release tag and the main branch are published automatically, so there's no local build required. The image bundles Node 26 and serves both the dashboard UI and its /api on port 3001.

I run Nexus as a Portainer stack built from the compose below. The reason is upgrades: moving to a new release is just Recreate with “Pull latest image” toggled on (for a stack, Pull and redeploy). It re-pulls ghcr.io/nexus-joe-kane/nexus:latest and rebuilds the container in place — your /data volume (settings, encrypted secrets, saved dashboards) carries straight across, with no CLI and nothing to back up first. The full click-path is in Option C below.
One thing worth pinning: use the :latest tag (or a fixed version like :1.64.0) — not :main. :latest only ever moves when a release ships, so a re-pull always lands you on the newest release; :main is the rolling development build — it runs fine, but it's an unreleased snapshot, and Settings → About & updates will report a rolling development stamp (like v1.69.3-1-g…) instead of the clean release number, nudging you back to :latest.

:latest) shows the new number straight after the pull.Option A — docker-compose.yml
Create a folder for Nexus (e.g. /opt/nexus on Linux or C:\nexus on Windows), save the following as docker-compose.yml, and run docker compose up -d:
services:
  nexus:
    image: ghcr.io/nexus-joe-kane/nexus:latest
    ports:
      - "3001:3001"
    restart: unless-stopped
    volumes:
      - nexus-data:/data        # named volume → DATA_DIR=/data inside the container
    environment:
      # Required on Linux/macOS: secrets are encrypted with AES-256-GCM
      # using this passphrase. Keep it stable — losing it makes stored
      # API tokens unrecoverable. On Windows DPAPI is used instead (no
      # passphrase needed), but setting one doesn't hurt.
      DASHBOARD_SECRET_PASSPHRASE: "choose-a-long-random-string"
      # Optional: change the listen port (update the ports mapping above too)
      # PORT: "8080"

volumes:
  nexus-data:
Then start it:
docker compose up -d            # start in the background
docker compose logs -f nexus    # follow startup logs
To stop: docker compose down. State persists in the nexus-data named volume across restarts and upgrades.
Option B — docker run (single command)
If you prefer a single command, the equivalent docker run:
docker run -d \
  --name nexus \
  --restart unless-stopped \
  -p 3001:3001 \
  -v /srv/nexus-data:/data \
  -e DASHBOARD_SECRET_PASSPHRASE="choose-a-long-random-string" \
  ghcr.io/nexus-joe-kane/nexus:latest
Here /srv/nexus-data is a host directory that maps to /data inside the container (the DATA_DIR). You can use any path you like; just make sure it exists and is writable by Docker. A named volume (-v nexus-data:/data) works equally well.
State lives in /data. That directory is the only thing that needs to survive a container recreation. It holds settings.json (non-secret config), secrets.json (encrypted API tokens), links.json (access links), the uploaded logo and history samples. Back it up — and back up your DASHBOARD_SECRET_PASSPHRASE alongside it.
If you back up nothing else: snapshot the /data volume, and keep your DASHBOARD_SECRET_PASSPHRASE somewhere separate (a password manager). /data is the entire state of the install; the passphrase is what decrypts the secrets inside it. Restore /data without the passphrase and everything comes back except your stored API tokens — no disaster, you'd just re-enter them, but worth avoiding. I let my normal host backup grab /data and never think about it again.
Option C — Portainer & other container UIs
Prefer managing containers from a web UI? The compose stack from Option A pastes into all of the popular ones unchanged — the only things that ever vary are where you paste it and which host port you pick. Keep the /data volume and the DASHBOARD_SECRET_PASSPHRASE in every case.
- Portainer — Stacks → Add stack → Web editor, paste the Option A compose, Deploy the stack. If port 3001 is taken on the host, change the left side of the mapping (e.g.
3002:3001). Update later with Re-pull image and redeploy on the stack. - Dockge — + Compose, name the stack
nexus, paste, Deploy. The built-in Update button runs the pull + restart for you. - Synology Container Manager (DSM 7.2+) — Project → Create, set the path to e.g.
/volume1/docker/nexus, paste the compose. Prefer a bind mount (/volume1/docker/nexus/data:/data) over a named volume so your data sits where Hyper Backup can reach it — and make the folder writable by uid 1000 (the container runs unprivileged). - Unraid — Docker → Add Container with repository
ghcr.io/nexus-joe-kane/nexus:latest, port3001 → 3001, path/mnt/user/appdata/nexus → /data, plus aDASHBOARD_SECRET_PASSPHRASEvariable. (The Compose Manager plugin takes the Option A stack as-is.) - CasaOS — App Store → Custom install → Import, paste the compose (or fill the same image/port/volume/env into the form).
- Coolify / Easypanel / Komodo — create a Docker Compose service and paste the stack unchanged.
Whichever UI you use, you end in the same place: open http://<host>:3001 (or the port you mapped), land on the setup wizard, and update later by re-pulling ghcr.io/nexus-joe-kane/nexus:latest — the /data volume carries everything across.
Folder permissions: the container runs as the unprivileged node user (uid 1000). A brand-new named volume gets the right owner automatically, but a pre-created bind-mount folder may not — if the logs show EACCES on /data, run docker exec -u 0 nexus chown -R node:node /data once and restart the container.
First-run wizard
Open http://localhost:3001 in your browser. If the server has not been configured before, the setup wizard runs automatically. It steps through 8 screens (a progress bar shows which step you're on) — here's the path, start to finish:


act_…) or signed key (NXS1.…) to unlock your plan — or pick Demo mode to explore with sample data and connect your helpdesk later.

.ics URL to show who's on call on the board, or leave it blank to skip.
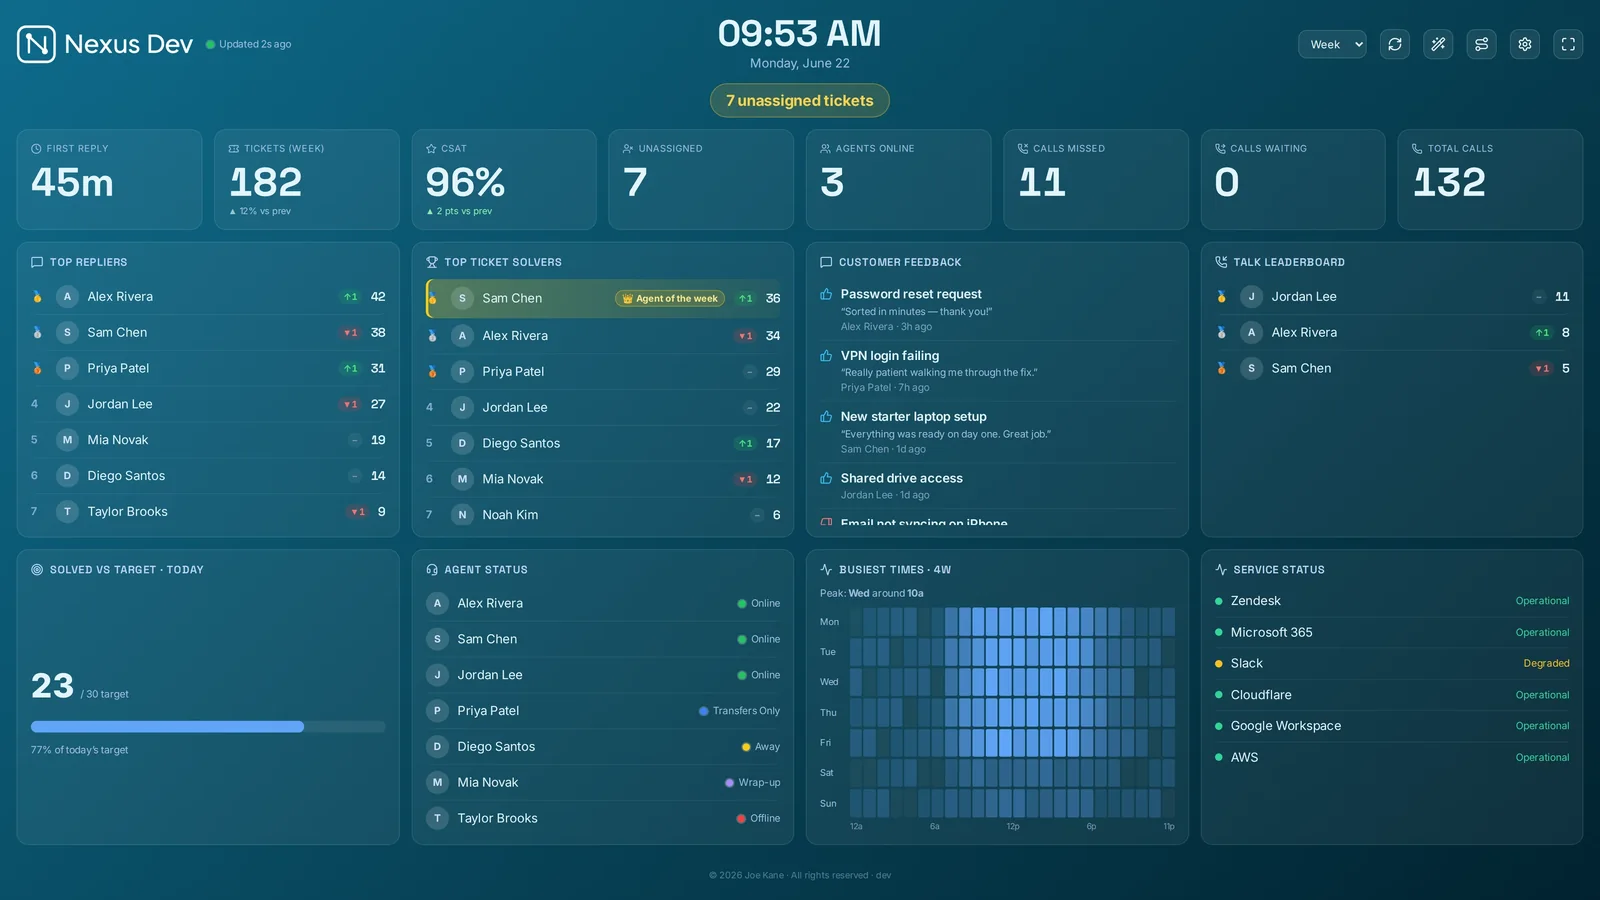

Logo tips for the sharpest result. Use a transparent PNG or an SVG, ideally landscape (around 240×60) and under 4 MB. The board scales it to a fixed height automatically, so the source resolution doesn't matter — but a solid (non-transparent) background shows as a block on dark themes, and the recolour / Match theme styles need transparency to tint the mark. On a dark board, upload a light logo or pick a recolour style; Match theme fills the logo with the live accent colour so it always reads (the upload dialog warns you if your image has no transparent background).

/data; you can go back and change any step before this.Each step in detail:
- Welcome — an introduction; nothing is saved until you finish.
- Licence — choose one of two options:
- I have a licence — paste your activation token (
act_…) or signed licence key (NXS1.…) and click Activate. The wizard verifies it inline and shows "Licensed — <plan>" when successful. - Demo mode — no account needed; the board fills with realistic sample data. Connecting your helpdesk later is one click from Settings.
- I have a licence — paste your activation token (
- Ticketing system — only shown when you activated a licence. Pick your helpdesk/PSA (Zendesk, Freshdesk, Freshservice, Jira Service Management, HaloPSA, SuperOps, NinjaOne, ConnectWise PSA, Zoho Desk, Help Scout or Front) and fill in its connection details (see Connect your helpdesk). Demo mode skips this step entirely.
- AI summary — optional: pick an AI provider (Anthropic / OpenAI) and paste an API key to power the daily summary panel. Leave it on the rule-based default if you don't have a key.
- On-call calendar — optional: paste a published
.icsURL to show who is on call. Leave blank to skip. - Theme — pick one of the 11 colour themes (and, in Settings → Appearance, one of the 6 panel looks); a live preview shows immediately.
- Logo — optional: upload a logo file for the top bar. Skipping keeps the default.
- All set — review a summary of your choices and click Finish setup to save everything.
Nothing is written to disk until you hit Finish setup on the last step. You can go back and change any step. After finishing, the setup wizard can be re-run any time from ⚙ Settings → Data & API → "Run setup wizard".
If the server was already configured (you set a .env with credentials, for example), the wizard is skipped and the board loads immediately. You can re-run it any time from Settings.
Setting a passcode later? On a fresh install (v1.44+), the first passcode you set under Settings → Security asks for the one-time setup code printed in the server's startup log (docker logs nexus). Details under Upgrading to v1.44.
Verify it worked
The server exposes a lightweight health endpoint that returns {"status":"ok"} when it is up and listening. Check it with:
curl http://localhost:3001/api/health
# → {"status":"ok"}
The Docker image runs this same check automatically (every 30 s, 20 s start period). If the health check is failing, check the container logs:
docker logs nexus                 # all logs
docker logs nexus --tail 50 -f    # follow recent output
# or with Compose:
docker compose logs -f nexus
Connect your helpdesk
Nexus reads live from the desk you already run — pick it in the first-run wizard and fill in its credentials. Zendesk (Support + Talk) is the fully live-tested flagship; Freshdesk, Freshservice, Jira Service Management, HaloPSA, SuperOps, NinjaOne, ConnectWise PSA, Zoho Desk, Help Scout and Front are fully supported, with every mapping unit-tested against the vendor's documented API. Credentials are encrypted at rest whichever you choose — see how credentials are stored.
The board adapts to your provider. Panels and KPI tiles whose data your helpdesk's API doesn't publish — phone metrics on a desk with no phone channel, CSAT where there's no ratings API — simply don't appear, on the board, in settings or in TV mode. No empty panels, no permanent zeros: each provider section below says exactly what's covered.

Zendesk FLAGSHIP · LIVE-TESTED
Everything on the board works with Zendesk: Support + Talk, saved view panels, CSAT, heatmaps, per-agent drill-downs. Headless installs can use environment variables instead of the wizard.
Step 1 — mint a Zendesk API token
Nexus authenticates to Zendesk with an API token. You create one inside Zendesk's admin interface — it only takes a minute:
- In Zendesk Support, click the grid icon (top-left Waffle menu) and open Admin Center.
- In the left sidebar of Admin Center, go to Apps and integrations → APIs → Zendesk API.
- Click the Settings tab. Make sure Token access is enabled (toggle it on if needed).
- Under the Active API tokens section, click Add API token.
- Give the token a descriptive name (e.g. "Nexus wallboard") and click Create.
- Copy the token now — Zendesk shows it only once. Paste it somewhere safe before closing the dialog.
- Click Save to confirm.
Use a dedicated service-agent account for the token where you can, so the board's access is easy to audit and rotate without affecting a real agent's account.
You will need three pieces of information for Nexus:
- Subdomain — the
yourcompanypart ofyourcompany.zendesk.com. Just the hostname segment, nohttps://and no.zendesk.com. - Agent email — the email address of the Zendesk agent account that owns the token (the account you were signed in as when you created it).
- API token — the string you copied in step 6 above.
Step 2 — connect in the setup wizard
On first launch — or any time from ⚙ Settings → Data & API → "Run setup wizard" — the wizard walks you through connecting your provider. The Zendesk flow is:
- Reach the Licence step and activate (or the board is in demo mode). See Activate your licence.
- On the Ticketing system step, click the Zendesk card to select it.
- A field group appears below the cards. Enter:
- Subdomain — e.g.
acme(the part before.zendesk.com). - Email — the agent email from Step 1.
- API token — the token you copied. This is a secret field (shown as
••••); it will be encrypted when saved.
- Subdomain — e.g.
- Once all required fields are filled, the Next button becomes active. Click it to continue the wizard.
- On the All set step, click Finish setup. The subdomain and email are saved to
settings.json; the token is encrypted intosecrets.json.
For headless or scripted deployments, supply credentials via the environment instead of the wizard. Copy .env.example to .env and set:
ZENDESK_SUBDOMAIN=yourcompany
ZENDESK_EMAIL=[email protected]
# Use ONE of these — plaintext for quick setup, or pre-encrypted:
ZENDESK_API_TOKEN=your-api-token
#ZENDESK_API_TOKEN_ENC=aesgcm:…  (from: npm run encrypt-secret -- <token>)
The _ENC form means a real token never sits in plaintext on disk. See Environment reference for details.
How credentials are stored & encrypted
Nexus never stores API tokens in plaintext. The token is passed to the server, which calls encryptSecret() before writing it to ./data/secrets.json. The encryption backend is chosen automatically per OS:
- Windows → DPAPI — the blob is encrypted by PowerShell's
ConvertFrom-SecureString(Windows Data Protection API), bound to the current Windows user and machine. A copiedsecrets.jsonis useless on a different machine; no passphrase is needed. - macOS / Linux → AES-256-GCM — the token is encrypted with a key derived from
DASHBOARD_SECRET_PASSPHRASEusing scrypt. The blob is portable across machines that share the same passphrase.
Encrypted values are prefix-tagged in the file (dpapi: or aesgcm:) so the server always knows which algorithm produced them. The token is never sent to any third-party service — it stays on your server.
On Linux/macOS, DASHBOARD_SECRET_PASSPHRASE must be set before the server starts, and it must stay the same across container recreations. If you lose or change it, the stored tokens cannot be decrypted — you will need to re-enter them via the wizard.
Common connection errors
If the board shows "No data" or panels fail to load, here are the most common causes:
- 401 Unauthorized — the token was entered incorrectly, or it belongs to a different account than the email. Re-enter both in ⚙ Settings → Data & API → "Run setup wizard" (the Ticketing step).
- Subdomain typo — the subdomain field should be just the hostname segment, e.g.
acme, notacme.zendesk.comorhttps://acme.zendesk.com. - Token access disabled — go back to Zendesk Admin Center → Apps and integrations → APIs → Zendesk API → Settings and make sure Token access is turned on.
- Agent lacks permissions — the agent account used for the token must have access to the data you want to show (e.g. Talk reporting requires a Talk licence on that agent seat).
- Stored token won't decrypt — on Linux/macOS, the
DASHBOARD_SECRET_PASSPHRASEchanged or was lost. Set it back to the original value, or re-enter the token via the wizard (which re-encrypts it with the new passphrase).
After fixing any of the above, re-run the wizard (or update the relevant fields in Settings) and reload the board. Talk data refreshes every 20 seconds, ticket panels every 60 seconds, and heavier aggregates (burndown, busiest times, history) every 5 minutes.
Freshdesk
- Freshdesk → your avatar → Profile settings → copy Your API key.
- In the wizard pick Freshdesk and enter your domain (
yourcofromyourco.freshdesk.com) and the key.
Covered: status & priority breakdowns, unassigned, due-soon, created/resolved trend, leaderboards, per-company counts, CSAT (satisfaction ratings), agent availability, first-reply time, the busiest-times heatmap, drill-downs. Not in Freshdesk's API (those panels hide themselves): phone metrics (Freshcaller is a separate product), resolution quality, top tags, custom views.
Freshservice
- Freshservice → your avatar → Profile settings → copy your API key.
- In the wizard pick Freshservice and enter your domain (
yourcofromyourco.freshservice.com) and the key.
Freshdesk's ITSM sibling: same coverage as Freshdesk for state, trends, leaderboards and drill-downs — departments stand in for companies. No CSAT list, presence or phone APIs in scope — those panels hide themselves.
Jira Service Management
- Create an API token at
id.atlassian.com→ Security → API tokens. - In the wizard pick Jira Service Management: site (
yourcofromyourco.atlassian.net), account email, the token — and optionally a project key (e.g.SUP) to scope the whole board, plus a service desk ID to light up the clients panel (Organisations).
Covered: status-category breakdowns, unassigned, due-soon, created/resolved trend, leaderboards, priorities, per-organisation counts (with the optional service desk ID), drill-downs (deep-link to the issue). No CSAT aggregate, presence or phone in core JSM's API — those panels hide themselves.
HaloPSA
- Halo → Configuration → Integrations → HaloPSA API → View Applications → Add: a client-credentials application with the
read:ticketsandread:customerspermissions (granting all works too — Nexus requests the broadest scope your application allows and falls back automatically). - In the wizard pick HaloPSA: your Halo URL, the client id + secret, and (hosted multi-tenant only) your tenant.
Covered: state & priority breakdowns (standard Halo status ids), unassigned, SLA at-risk (from each ticket's SLA target), created/closed trend, leaderboards, per-client counts, drill-downs. Custom workflows with non-standard status ids may need the extended status map — tell us what you see.
Using Halo's Microsoft Teams integration? Teams calls reach Halo as agent-logged tickets (the call pop-up opens a call script), so they already count in your trends and leaderboards. Halo's API publishes no separate call statistics, which is why the Talk panels don't appear on a Halo board.
SuperOps
- In SuperOps, copy your API token from My Profile → API Token, and note your sub-domain from Settings → MSP Information.
- In the wizard pick SuperOps, choose your data centre (US or EU), and enter your sub-domain and the API token.
Covered: ticket state & priority breakdowns, unassigned, created/resolved trend, leaderboards, per-client counts and drill-downs. SuperOps exposes both a PSA (ticketing) and an RMM (device monitoring) side — the RMM side is set up separately under Monitoring. Panels its API doesn't publish hide themselves.
NinjaOne
- In NinjaOne, go to Administration → Apps → API and create an API application using client credentials.
- In the wizard pick NinjaOne, choose your region, and enter the client id + client secret.
Covered: ticket state & priority breakdowns, unassigned, created/resolved trend, leaderboards, per-organisation counts and drill-downs. Like SuperOps, NinjaOne has a separate RMM (device monitoring) side, configured under Monitoring. Unsupported panels hide themselves.
ConnectWise PSA
- In ConnectWise, under System → Members → API Keys, create a public/private API key pair for a member.
- In the wizard pick ConnectWise PSA and enter your API host (e.g.
api-na.myconnectwise.net), your company id, the public + private keys, and your clientId.
Covered: ticket status & priority breakdowns, unassigned, created/closed trend, leaderboards, per-company counts and drill-downs. Custom board statuses may need the extended status map — tell us what you see.
Zoho Desk
- In the Zoho API console create a Self Client and generate a refresh token with the
Desk.tickets.READ Desk.basic.READ Desk.settings.READscopes. - Find your Org ID under Zoho Desk Setup → Developer Space → API, and note your data centre (the suffix of your
desk.zoho.com/eu/in…domain). - In the wizard pick Zoho Desk and enter the data centre, org id, client id + secret and refresh token.
Covered: ticket status breakdowns, unassigned, created/solved trend, leaderboards, per-account (client) counts & drill-downs, teams, and customer-happiness CSAT.
Help Scout
- In Help Scout go to Your profile → My Apps → Create My App (a private app) and copy its App ID and App Secret.
- In the wizard pick Help Scout and paste the App ID + App Secret — Nexus authenticates with the Mailbox API 2.0 (client-credentials).
Covered: conversation status breakdowns, unassigned, created/closed trend, leaderboards, teams, and happiness-rating CSAT. Help Scout has no filterable customer-organisation, so the per-client panel isn't offered for it.
Front
- In Front go to Settings → API & Integrations → API tokens and create a token (a read scope is enough for the board; add write only if you use Switchboard auto-assign).
- In the wizard pick Front and paste the API token.
Covered: open/archived conversation counts, unassigned, created/solved trend, leaderboards, teams, top tags, teammate availability (presence) and per-account (client) views. Front has no native CSAT or phone channel, so those panels don't appear.
Monitoring vendors UNIFI ALL PLANS · OTHERS ENTERPRISE
Monitoring puts per-client health next to your support numbers — perfect for an MSP/IT wall. Each connected tool gets its own panel, shown only once it's set up, and rolls its problems up per client into the same name · issues · status rows. UniFi (local controller) is live-tested and in every plan; the cloud network, RMM, backup and security vendors below are available on the Enterprise plan. Configure under Settings → Data & API → Monitoring.
Every vendor normalises to the same rows — down, warning, ok, worst clients first — and two things make a panel trustworthy at a glance:
- Test connection — next to Save in each vendor's card, this reaches the integration's live API and tells you on the spot whether your credentials work and how many clients it can see — so you confirm a setup before you put it on the wall, no guessing.
- Click to drill down — click any client row on the panel to open its full per-client list — every site/device behind the rolled-up count, so you go from "Acme: 3 issues" to exactly which three.
Unconfigured (or un-licensed) vendors show clearly-labelled sample data, never an error.

All 15 vendors & how to connect each
- UniFi STABLE — controller URL + a local (read-only) account; self-signed TLS allowed by default.
- Meraki — Dashboard → My profile → API access key, plus your organisation ID. Device availability rolls up per network.
- Aruba Central — your regional API gateway URL + an OAuth app (client ID, secret and refresh token — Central → API Gateway → System Apps & Tokens). Central access tokens only live ~2 hours, so Nexus refreshes them itself and rotates the stored refresh token; a static token also works if you rotate it externally. AP status grouped by site.
- Omada — controller v5.9+: Settings → Platform Integration → Open API app (Omada ID, client id + secret).
- SuperOps (RMM) — your data centre (US/EU), account sub-domain + the API token (My Profile → API Token). Device alerts roll up per client.
- NinjaOne (RMM) — region + a client-credentials API app (client id + secret) from Administration → Apps → API. Device health per organisation.
- N-able (N-sight RMM) — your N-sight server host + API key. Device & check status grouped per client.
- Auvik — your region (the token in your Auvik URL, e.g.
us1) + your Auvik login email and an API key (Profile → API key). Network alerts per client site. - Domotz — API endpoint host + your API key. Agent/site status rolled up per client.
- Acronis (backup / cyber-protection) — your data-centre URL + an API client (client id + secret). Backup & protection status per tenant.
- Huntress (managed EDR / security) — API key + secret from the Huntress portal. Incidents & agent status per organisation.
- Datto RMM — your API URL (Setup → Users → Generate API Keys) + the API key & secret. Offline devices roll up per site.
- Kaseya VSA — your VSA server URL, a username + a personal access token. Offline agents roll up per organisation.
- ConnectWise Automate — your Automate server, a username + password (ideally a non-2FA API service account) and a ClientID on v2020.11+. Offline computers per client.
- Liongard — your instance subdomain + an access key & secret (Account Settings → Access Tokens). Open actionable alerts per environment.
Set up as many as you like; each gets its own panel. PSA (ticketing) and monitoring are separate slots — a deployment can run one of each (e.g. Zendesk for tickets + SuperOps for devices). SuperOps and NinjaOne expose both sides; the RMM side is always configured here under Monitoring.
Custom connectors (Enterprise)
Don't see your tool in the list? Wire it up yourself. A custom connector points Nexus at a JSON endpoint you control, and a new Custom Data panel renders the result — turning "we don't integrate with X" into "connect X yourself", with no bespoke adapter needed.
Your endpoint returns a small, documented shape — KPI tiles and/or status rows:
{
  "title": "Backups",
  "metrics": [{ "label": "Protected", "value": 98, "unit": "%" }],
  "rows":    [{ "name": "Acme Corp", "detail": "1 job failed", "status": "down" }]
}(status is ok, warning or down — the same three-state health the monitoring panels use.) Add a connector in ⚙ Settings → Data & API → Custom connectors: a name, the URL, optional auth (a bearer token or a custom header), then Test to confirm the URL, auth and response shape before relying on it. Up to six connectors, each shown in the Custom Data panel.
The board fetches the endpoint server-side with the same safety as the built-in integrations — the address is run through the safe-address (SSRF) check before the request, with a short timeout, no redirects and a hard response-size cap — and the token is held in the encrypted secrets store, never in plain settings. A connector that fails to load shows its error inline rather than breaking the panel.
Push mode — let your systems send data to the board
Some sources can't sit behind a polite JSON endpoint — a SOAR playbook that fires on detections, a sensor script behind a firewall, a CI pipeline. Switch a connector to push mode and the flow inverts: your system POSTs the same feed shape to the board whenever it has something to say.
curl -X POST https://your-board/api/connectors/<id>/ingest \
  -H "Authorization: Bearer <sender token>" \
  -H "Content-Type: application/json" \
  -d '{"metrics":[{"label":"Critical alerts","value":2}],
       "rows":[{"name":"dmz-sensor-1","detail":"C2 beacon suspected","status":"down"}]}'
Each push replaces the previous one, and every push must carry the connector's sender token — set one in the editor; a push connector with no token refuses everything, so there is no anonymous ingest. The body is validated against the same bounded feed shape, and if the sender goes quiet for more than 30 minutes the panel flags the feed as stale rather than showing frozen numbers as fresh. Push works on passcode-protected boards too — the sender authenticates with its token, not a board login.
Nexus also keeps a short storyline per pushed row — when it last changed status and its recent path (the small fading dots beside the name). A row that's gone down shows how long ago it turned, so "when did this start?" reads straight off the wall.
Board of boards — multi-desk federation
Because a push connector accepts data from anything that can send a request, one Nexus board can feed another. Run a small script on each regional desk that reads its own board's numbers and pushes them to a group board's connector — a head-office wall showing every desk's headline health, while each desk stays fully autonomous:
# On each desk, on a timer (cron/systemd/Task Scheduler):
STATS=$(curl -s https://desk.example.com/api/tickets/status-breakdown)
OPEN=$(echo "$STATS" | jq '.new + .open')
curl -X POST https://group-board.example.com/api/connectors/<id>/ingest \
  -H "Authorization: Bearer <sender token>" -H "Content-Type: application/json" \
  -d "{\"rows\":[{\"name\":\"London desk\",\"detail\":\"$OPEN open\",
       \"status\":\"$([ "$OPEN" -gt 50 ] && echo warning || echo ok)\"}]}"
The group board sees a name, a number and a status per desk — nothing else crosses over, and if a desk stops reporting its row goes stale rather than quietly healthy.

Custom connectors are an Enterprise feature — see Plans.
Activate your licence
Activation is a single paste. Start your free trial (or subscribe), copy your one-time token, and drop it into Nexus — from then on it renews itself invisibly.
- Start your 14-day free trial (or subscribe) on the pricing page — you’ll be sent to Stripe Checkout, which takes a card to start the trial but doesn’t charge it until the trial ends.
- After paying, copy your one-time activation token (starts
act_…) from the success page, or from the email sent to your billing address. - In Nexus, either paste the token during the first-run wizard’s Licence step and click Activate, or open ⚙ Settings → Licence and click Activate / refresh licence.
- The server contacts the licence service at
https://licensing.joekane.org/activate, exchanges the token for a signed key, and stores the key insettings.json. The status badge in Settings changes to ✓ Licensed — <plan>. - That’s it. Nexus re-fetches a fresh signed key once a day and renews invisibly while your subscription is active.
The same field also accepts a signed licence key pasted directly — a self-contained string that starts NXS1.…. These are used for offline / air-gapped installs: the key is verified offline by its Ed25519 signature (the matching private key is never shipped) and never phones home to renew, so it stays valid until its built-in expiry date regardless of any outage of the billing service.
Lost your token? Get in touch from the address you subscribed with and I’ll send it straight over.

Renewal mechanics
Once activated, Nexus runs two background jobs on the server:
- Daily re-issue — every 24 hours (and once ~8 seconds after boot) the server calls
/activateon the licence service to fetch a fresh signed key and store it. This keeps the key’s expiry rolling forward while the subscription is active. - Regular heartbeat — about every 30 minutes the server calls
/validateto confirm the licence still exists and has not been revoked. This means a cancellation or revocation takes effect within the half-hour.
Both jobs are fail-open: a network blip, a slow response, or even an unreachable licence service never locks the board. The lock only engages if the last successful /validate response was more than 7 days ago (measured from the server’s clock). A brand-new activation that has never contacted /validate is never grace-locked.
The signed key itself embeds an expiry date equal to the billing-period end plus a 3-day grace buffer (the GRACE_DAYS default on the licence service). Even if the subscription lapses, the key stays usable for up to 3 days past the billing-period end while the system catches up. After that, the offline key check will return expired and the board locks.
Licence statuses
The status badge in ⚙ Settings → Licence (and the lock screen, if shown) can show:
- ✓ Licensed (
valid) — a signed key is present, its Ed25519 signature checks out, and it has not expired. - ✓ Trial active (
trialing) — same as valid but the Stripe subscription is in a trial period. - Expired (
expired) — the key’s built-in expiry date has passed. The board is locked. Renew on the pricing page, or Refresh licence in Settings if you are already subscribed and the daily re-issue simply hasn’t run yet. - Revoked (
revoked) — the vendor revoked this licence key (e.g. fraud, chargeback). The board is locked; contact us if you believe this is an error. - Invalid key (
invalid) — the pasted string does not match the expected format or the Ed25519 signature is wrong. Check that the key was copied in full (no truncation). - Unlicensed (evaluation) (
missing) — no key has been entered. Paste one in Settings → Licence or use Demo mode. - Stale — the last successful heartbeat was more than 7 days ago (server cannot reach the licence service). The board locks to prevent indefinite use without a valid subscription. Check outbound connectivity and try Refresh licence.
Moving to a new server
Your licence is tied to your activation token, not to a specific server IP or hostname. To move Nexus to a new server:
- Copy your
/datadirectory from the old server to the new one (it holdssettings.jsonwith the stored licence key). - Set the same
DASHBOARD_SECRET_PASSPHRASEon the new server (so the encrypted secrets can be decrypted). - Start the new container. Because the key and activation token are already in
settings.json, the licence is active immediately and the daily re-issue will run within 8 seconds of boot. - Decommission the old server. There is no per-server binding — the same token works on as many servers as you like.
Clients
Where the builds come from. The server runs from the public Docker image ghcr.io/nexus-joe-kane/nexus — the source repositories are private, but the image is published publicly to GHCR (GitHub's container registry), and that public image is exactly what you pull to deploy. The desktop and Android client builds come from the Releases page (served from my own infrastructure), and iOS ships on the App Store. Anything not available through those — an older build, the unsigned iOS .ipa, or a native/from-source deployment — comes through me: the contact form.
Desktop app
A lightweight Electron shell that connects to your hosted Nexus server and shows the wallboard in a dedicated window — great for a dedicated display or a kiosk machine. The app bundles no server at all, just the window shell. On first launch it asks for your server URL, stores it locally, and loads that server's web app directly — so /api, fullscreen and all other features work exactly as in the browser.
Install & first launch
Grab the latest build for your OS from the Releases page. The builds are currently unsigned (code-signing is on the roadmap), so you will see an OS security prompt on first launch.
-
macOS —
Nexus-*.dmg- Download the
.dmgand double-click it to mount the disk image. - Drag Nexus to your Applications folder.
- Because the build is unsigned, macOS Gatekeeper will block a direct double-click with "app cannot be opened because it is from an unidentified developer". To bypass: right-click (or Control-click) the Nexus icon in Applications, then choose Open from the context menu. A dialog appears with an Open button — click it.
- Gatekeeper remembers your choice; subsequent launches work normally.
- Download the
-
Windows —
Nexus Setup *.exe- Download and run the installer. Windows SmartScreen may show "Windows protected your PC" because the build is unsigned.
- Click More info on the SmartScreen dialog, then click Run anyway.
- The NSIS installer places Nexus in
%LOCALAPPDATA%\Programs\Nexusand adds a desktop shortcut.
-
Linux —
Nexus-*.AppImage- Download the
.AppImagefile. - Make it executable:
chmod +x Nexus-*.AppImage. - Run it:
./Nexus-*.AppImage.
- Download the
On first launch a server setup screen appears. Enter your Nexus server URL (e.g. https://dash.yourcompany.com or http://192.168.1.10:3001 on a LAN) and click Connect. The URL is stored in the app's user-data config file alongside the server URL; it is never sent to any third party.
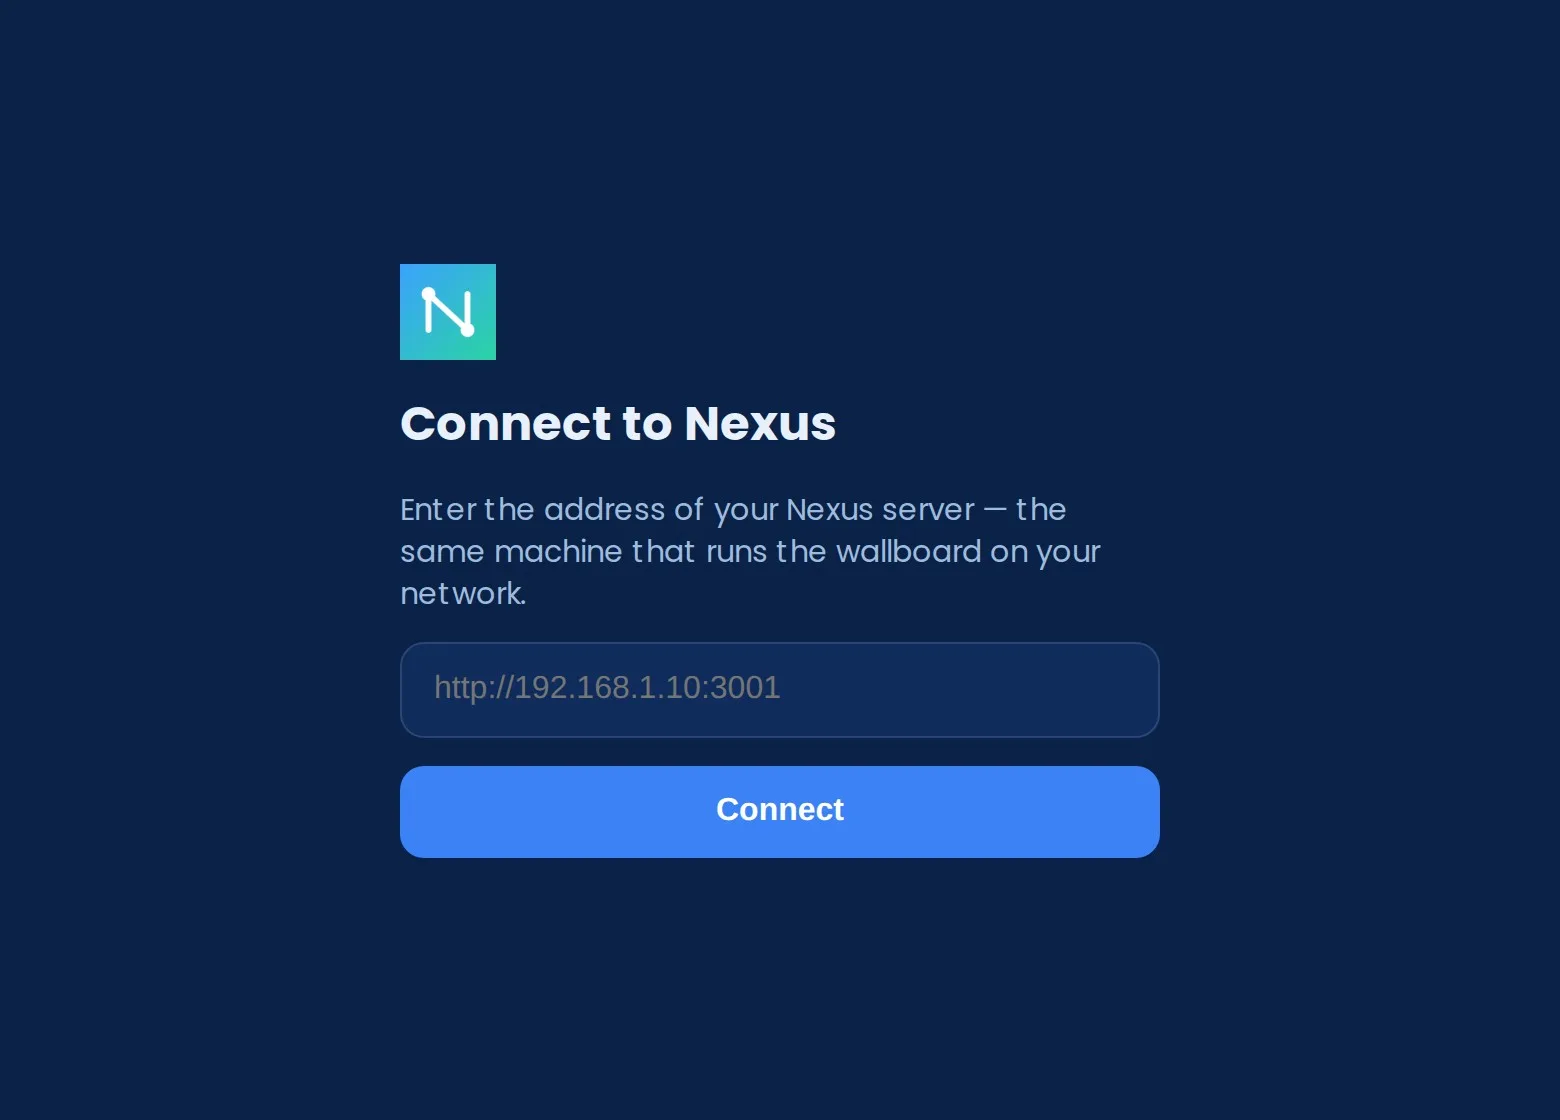
To change the server later: open the Nexus menu in the menu bar and choose Change server… — this brings back the setup screen.
Packaged builds update themselves in the background. When a newer version is downloaded, a dialog appears with Restart now or Later. All dashboards and data live on your server's /data volume — not in the Electron shell — so applying an update cannot lose anything.
Mobile apps (iOS & Android)
A thin Capacitor shell that packages the Nexus wallboard as a native iOS and Android app. On phones the board reflows to a single-column, safe-area-aware layout with native touches, the screen stays awake, and you get a themed status bar, splash and haptics.
Like the desktop app, mobile is a pure client: on first launch it asks for your Nexus server URL and talks to its /api. Change it later under ⚙ Settings → Server URL.
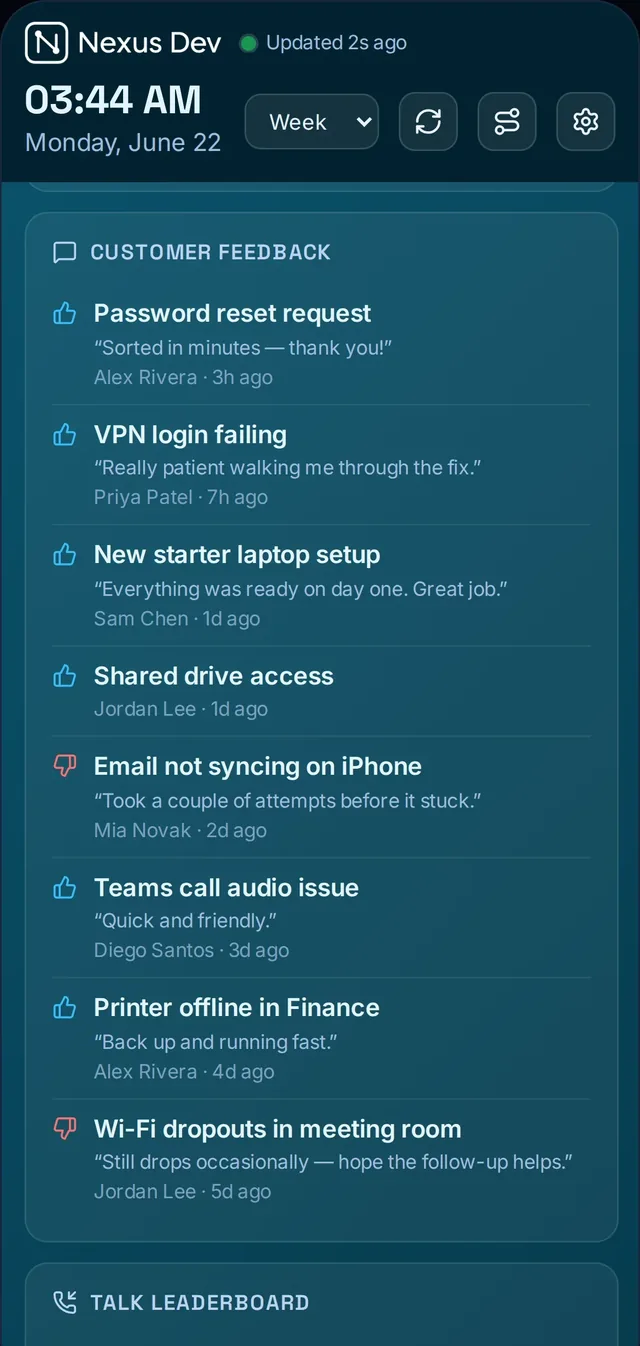
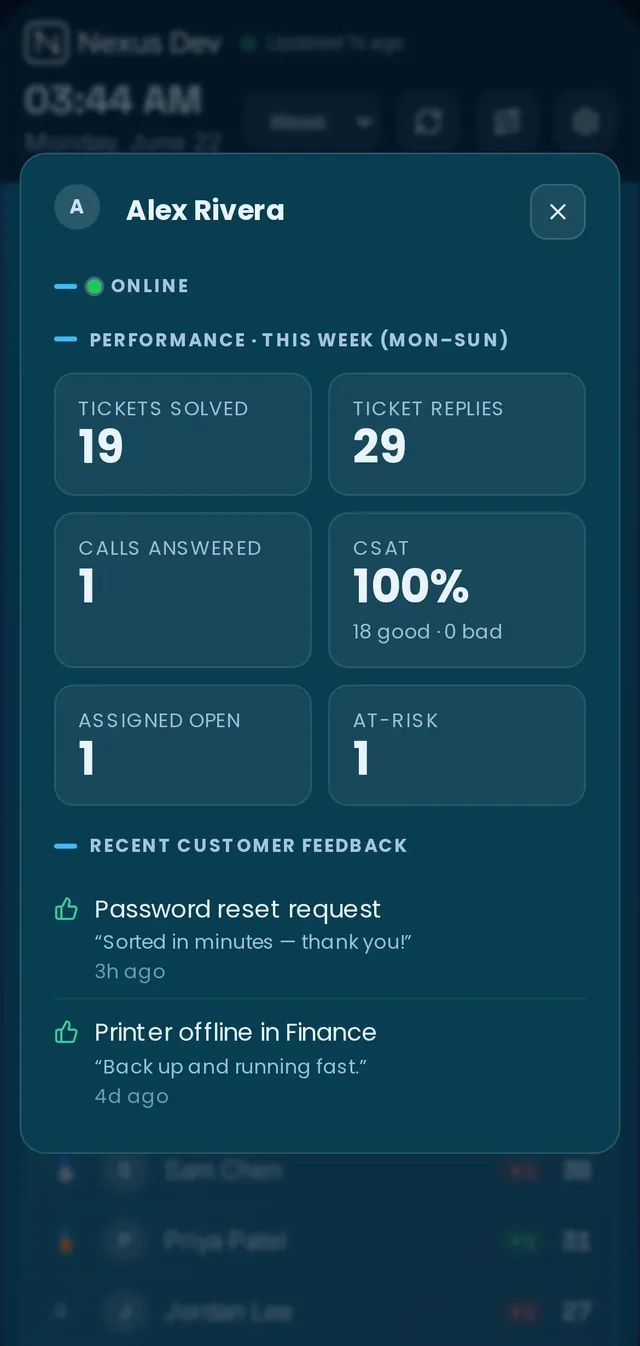
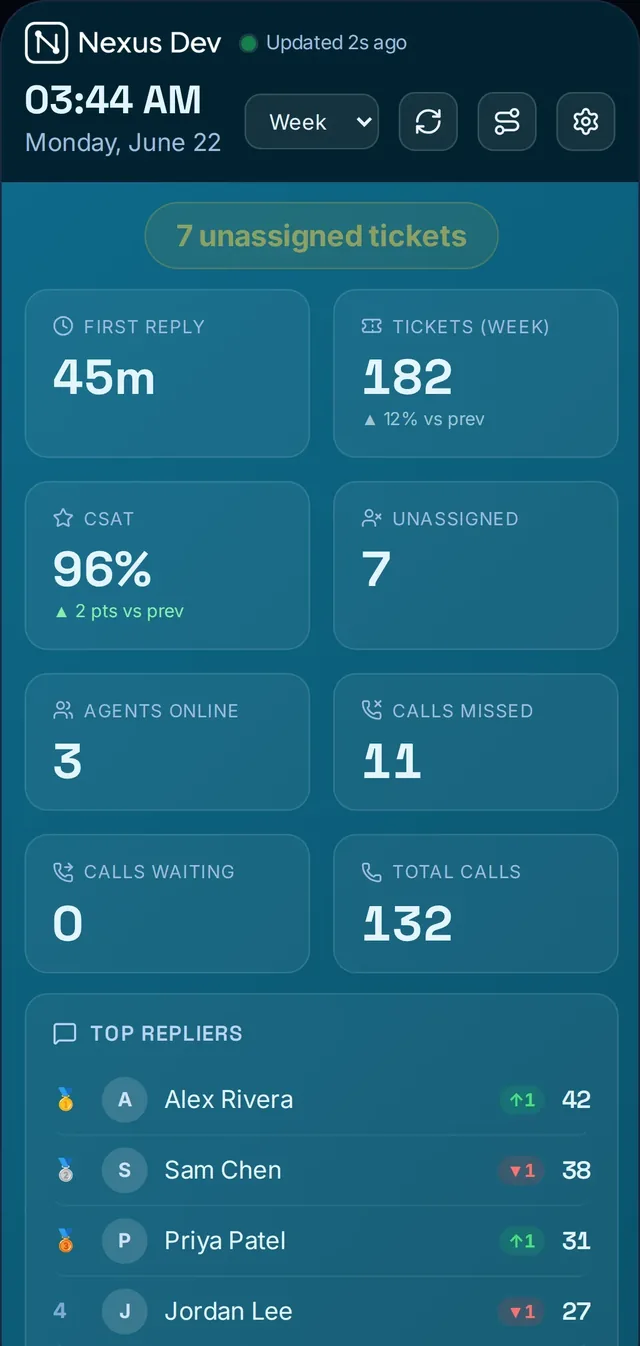
iOS — App Store
New — Nexus is now on the App Store. Download Nexus Client for iPhone & iPad directly — no TestFlight needed.
The easiest way to install on iPhone or iPad is straight from the App Store:
- Open Nexus Client on the App Store on your iPhone or iPad — or search Nexus Client in the App Store.
- Tap Get to install, then open Nexus.
- On first launch a server setup screen appears. Enter your Nexus server URL (e.g.
https://dash.yourcompany.com) and tap Connect.
Prefer to sign and deploy it yourself? An unsigned Nexus-iOS-Client-unsigned.ipa — which you can sign with your own Apple Developer certificate and install via Sideloadly or Xcode — is available on request (it isn't on the public Releases page) — just use the contact form.
iOS requires HTTPS for non-localhost connections. Use a server URL that starts with https://. A reverse proxy with a Let's Encrypt cert is the simplest way to get HTTPS on a self-hosted server.
Android — Google Play & APK
Two ways to run Nexus on Android — both are HTTPS-only client shells that point at your server:
Google Play CLOSED BETA · INVITE ONLY — Nexus Client is in closed testing on Google Play, so it installs and auto-updates like any Play app. Access is invite-only during the beta: request it via the contact form (pick "Android beta") and include the Google account email you use on your phone (Google requires a Google account to join a test) and we'll add you as a tester. When the app clears Google's closed-test period and moves to a public listing, no invite will be needed.
Sideload the APK — no invite, installs on any device:
- Download
Nexus-Android-Client.apkfrom the latest release. - Transfer it to your Android device (via USB, Google Drive, or a direct browser download).
- Open your device's Settings → Apps (or Special app access) and enable Install unknown apps for the app you are installing from (e.g. "Files" or "Chrome"). The exact path varies by Android version and manufacturer.
- Open the
.apkfile in a file manager and tap Install. - Once installed, open Nexus. Enter your server's
https://URL on the setup screen and tap Connect.
Alternatively, sideload via ADB: adb install Nexus-Android-Client.apk.
The APK is release-signed with a permanent key (no developer account needed). Like the iOS client it is HTTPS-only, so point it at a https:// server URL — run Nexus behind TLS / a reverse proxy with a Let's Encrypt cert.
If install is blocked: a sideloaded APK trips Google Play Protect's "hasn't seen an app from this developer" warning. Usually More details → Install anyway clears it — but on recent devices Play Protect can hard-block the install (the dialog shows only OK and you then get "App not installed"). When that happens, pause scanning: open the Play Store → profile icon → Play Protect → ⚙ Settings → turn off "Scan apps with Play Protect", install the APK, then switch it back on. On Samsung, also turn off Settings → Security and privacy → Auto Blocker. These are device/Play policies — the APK itself is release-signed and installs cleanly once Play Protect is allowed through.
The app ships with Capgo live-updates, so the web bundle can be pushed over the air — no Play Store review for routine updates. A repeatedly-failing bundle self-heals back to the installed version.
Zendesk app
A standalone Zendesk Apps Framework (ZAF v2) app that adds a Nexus item to the Zendesk Support nav bar and opens the full wallboard inside Zendesk — no separate Nexus server required. Unlike the desktop and mobile clients, the Zendesk app bundles the wallboard UI and reads data straight from your Zendesk account via your agent session — no API token to manage and nothing to host.

Install steps
A ready-to-upload Nexus-Zendesk-App.zip is available from the Releases page (or on request via the contact form if you can't find it there). Install it as a private app:
- In Zendesk Support, open Admin Center (grid icon → Admin Center).
- Go to Apps and integrations → Zendesk Support apps.
- Click Upload private app (top-right button).
- Give the app a name (e.g. "Nexus Wallboard"), choose
Nexus-Zendesk-App.zip, and click Upload. Zendesk validates the package — this takes a few seconds. - A preview screen appears. Click Install.
- A Nexus icon appears in the Zendesk Support left nav bar. Click it to open the live board — no further configuration; it uses the signed-in agent's session.
What works inside Zendesk: the board reads Support + Talk under the agent's session (tickets, satisfaction ratings, Talk stats); Service Status (public Atlassian Statuspage feeds fetched client-side); branding via ⚙ Settings → Logo. Layout and date-range choices persist in the browser.
What's different from the server deployment:
- Fullscreen is not available — Zendesk deliberately disables the browser Fullscreen API for app iframes. For a kiosk/TV board, use the desktop app or a browser pointed at the server.
- Server-only panels are hidden — On Call, UniFi Monitoring, Projects and Site Visits panels need a Nexus server and do not appear in the Zendesk app.
Licence & account binding
The Zendesk app is bundled with Pro and Enterprise plans. It verifies the licence itself — no server needed:
- After installing the app, open it from the nav bar.
- A licence gate appears. Paste your activation token (
act_…) or signed key (NXS1.…) and click Activate. - The app contacts the licence service, verifies the key, and stores the result in the browser. The board loads immediately.
Account binding: the licence binds to your Zendesk account on first validation. The default cap is 2 Zendesk accounts per licence (e.g. your production and sandbox instances). If you install the app on a third unrelated account, activation shows "Licence in use elsewhere". Contact us to reset a binding.
Configure
Build your board
The board is fully configurable. From edit mode you can:
- Drag panels to reorder and grab a corner to resize.
- Set a fixed column count, or hit ✦ Auto-arrange to fit the screen.
- Pick a grouped layout preset — for a TV, a desk monitor, or a phone — for a one-click arrangement.
- Set a constant auto-scroll speed for a board taller than the screen.
- Lock the board for a public screen so nobody can fiddle with it.
- Pick a density — compact, cosy or comfortable — to trade detail for breathing room.
- Set goals and targets so KPIs show RAG status and the team thermometer fills.
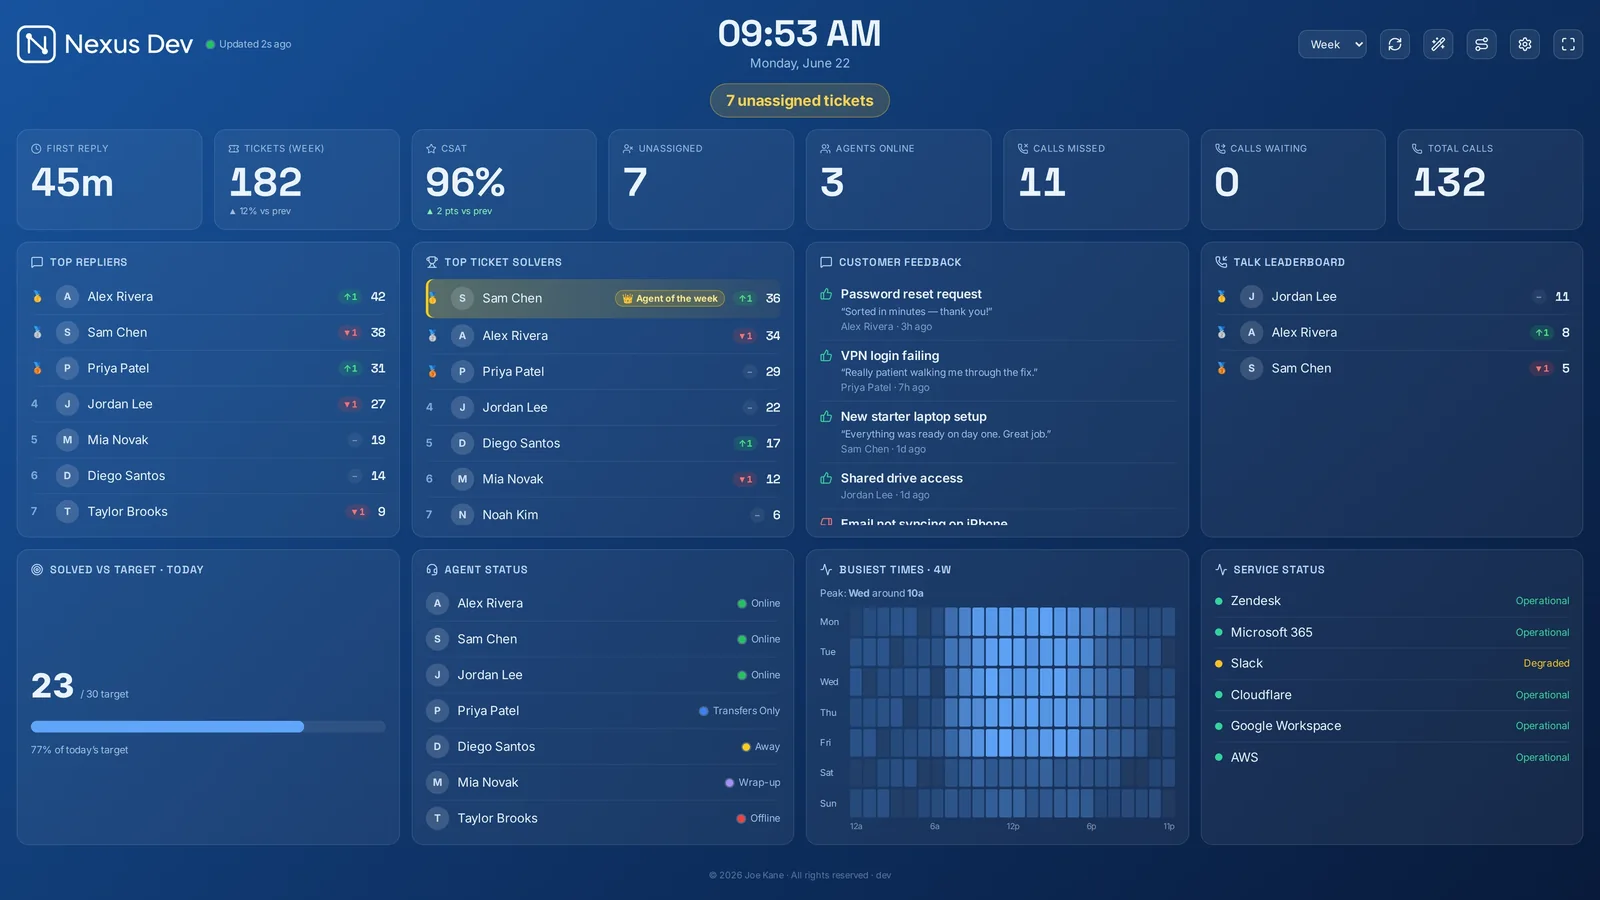
Each device remembers its own layout — your phone view is independent of the wall. The whole layout exports and imports as a copyable code, so you can clone a board onto another screen in seconds.
Keyboard shortcuts: R Refresh · S Settings · T TV mode · F Fullscreen · ←/→ Date range · ? Help · Esc Close.
Panels
Panels are the building blocks of the board. Toggle any on or off, reorder them, resize them, and pin each to its own date range. There are over 50 in all (plus one per configured monitoring vendor), grouped into Tickets, People and Ops.
Tickets — everything about the queue and how it's moving:
- At-Risk · Unassigned · Open by Status / Priority / Client — or Open by your own custom field (pick any of your desk's dropdown/checkbox fields and get an "Open by <field>" breakdown)
- Created-vs-Solved trend · First Response (vs target) · Solved vs Target
- SLA Countdown · Backlog Burn-down · Busiest Times heatmap
- Resolution Quality (reopen rate + first-contact resolution) · Top Tags
The Created-vs-Solved trend also spots the weird days for you: a day with wildly more (or fewer) new tickets than the range's norm gets a subtle tint and a plain-English tooltip, so a ticket flood stands out without anyone studying the bars — and a normal weekday/weekend rhythm doesn't light up.
People — who's doing what, and a bit of friendly competition:
- Top Repliers · Top Ticket Solvers · Talk Leaderboard
- CSAT by Agent · Customer Feedback · CSAT / Solved gauges
- Agent Status · Team Goal thermometer · Streaks & Badges
People panels show each agent's profile photo pulled from your helpdesk where it exposes one (Zendesk does), falling back to their initials.
Ops — context beyond the ticketing queue:
- Service Status (live from public status pages) · Daily Summary (AI or rule-based)
- On Call · Monitoring (one panel per configured vendor — UniFi on all plans, 14 more on Enterprise) · Saved Zendesk View panels (×3 — your desk's own built-in views) · Custom View panels (a Zendesk search query you type yourself) · Scan-to-open QR
- Client Health (PSA queue × monitoring health per customer) · Custom Data (your own JSON feeds — Nexus pulls your endpoint, or your systems push to the board) · Calculated KPI tiles
Several ops panels are optional integrations — see Environment & integrations to wire up the AI summary, on-call calendar, UniFi and status feeds.
Per-panel controls: reorder by dragging; resize by grabbing a corner; pin a date range so one panel ignores the board-wide range; give a panel a custom title or accent colour.

KPIs & goals
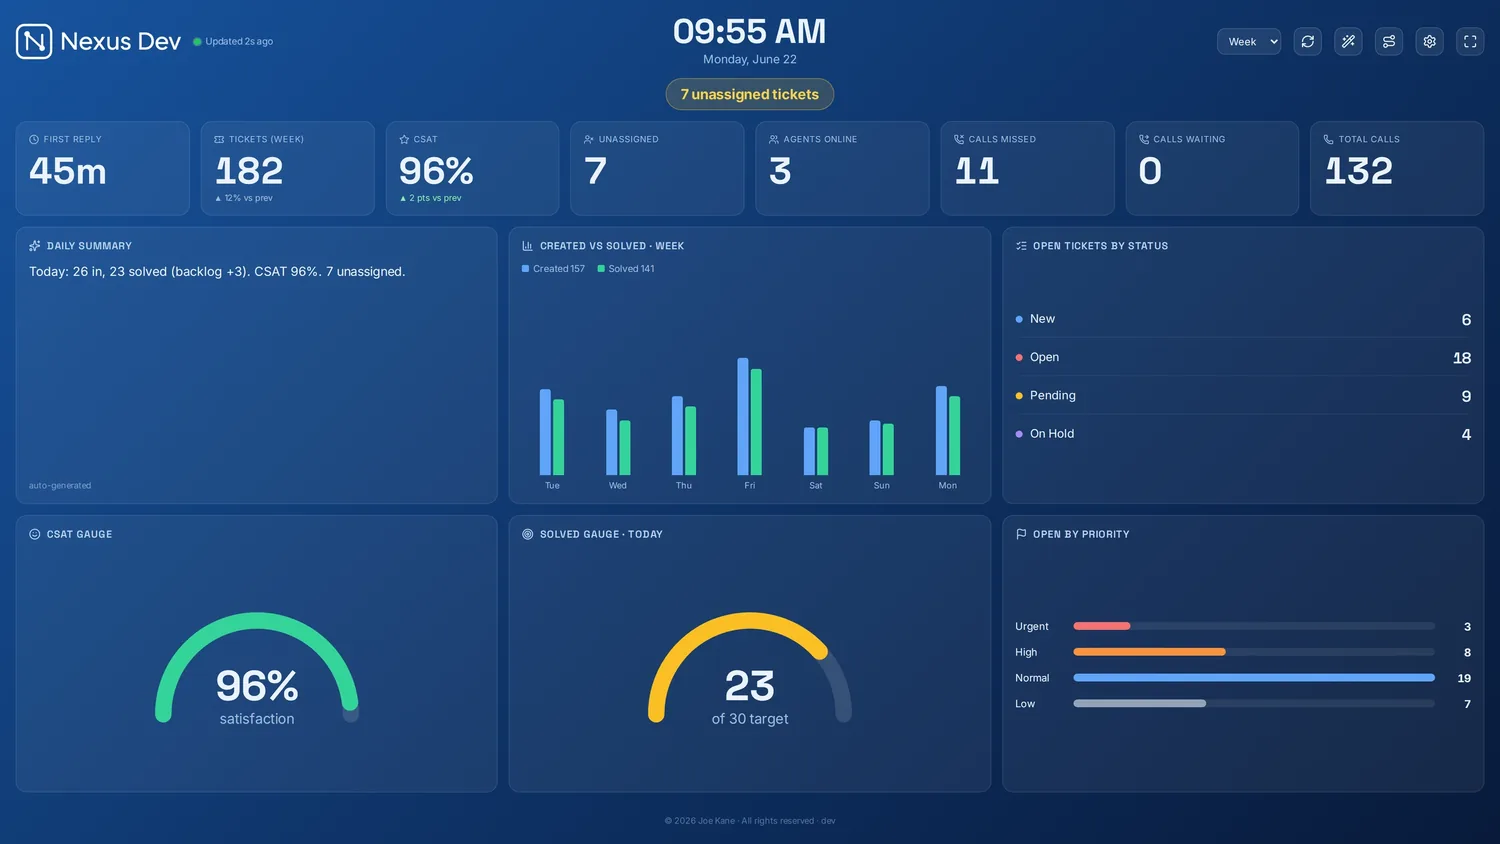
A top KPI strip shows the numbers that matter — First Reply, Tickets, CSAT, Unassigned, Agents Online, Calls Missed/Waiting, Total Calls — each with a per-KPI goal and RAG (red/amber/green) status, a ▲/▼ change vs the previous period, and an optional big-number spotlight mode for an across-the-room read.

Gauges for CSAT and Solved-vs-target give an at-a-glance dial. A Team Goal thermometer fills as the team works towards the day's solved target. The Solved vs Target panel also forecasts the day: once the working day is under way it projects the current pace to a likely end-of-day total ("On pace for ~46") and flags whether you're on track — so the room knows mid-afternoon whether to push.
Gamification (opt-in): an agent-of-the-period crown on the current leader, ↑/▼ rank arrows showing movement vs the previous period, and streaks & badges that persist across restarts. When the team smashes its target, the board celebrates: confetti + a chime when the daily goal is hit, the backlog is cleared, or a 50-solved milestone is crossed.
Leaderboard gamification and celebrations are part of Pro and Enterprise. The core KPI strip, goals and gauges are available on every plan — see Plans.
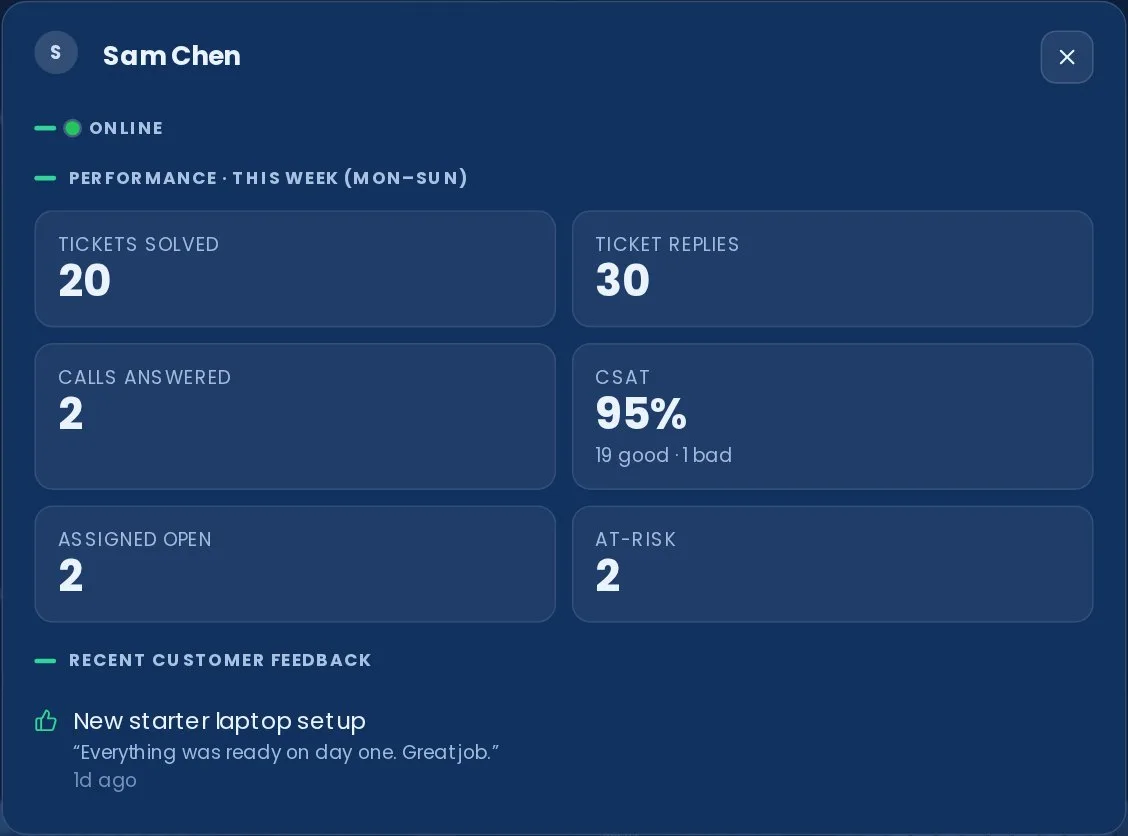
A top-bar selector switches time-scoped panels between This week (Mon–Sun), Today, Last 7 / 30 days and This month; any single panel can be pinned to its own range. Click any ticket count to drill into the underlying tickets, or click any agent for a per-agent review. Optionally measure business-hours First Response so overnight and weekend tickets don't inflate it.
Calculated KPIs
Build your own KPI tiles from a formula over the board's own figures — a success rate as solved / created * 100, a single "needs attention" number as unassigned + atRisk, or calls cleared as callsTotal - callsWaiting. Add the Calculated KPIs panel to a board to show them. Operators + - * / ( ) and the functions min, max, abs, round, floor, ceil are supported, and each formula is validated as you type against the available metrics (solved, created, tickets, unassigned, atRisk, csat, firstReply, callsWaiting, callsTotal, agentsOnline).
Formulas are evaluated on the board from data it already holds — there's no eval and no extra fetches, and a tile whose data is missing (or whose formula divides by zero) shows "—" rather than a misleading number. Define up to six metrics in ⚙ Settings → Panels → Calculated KPIs.
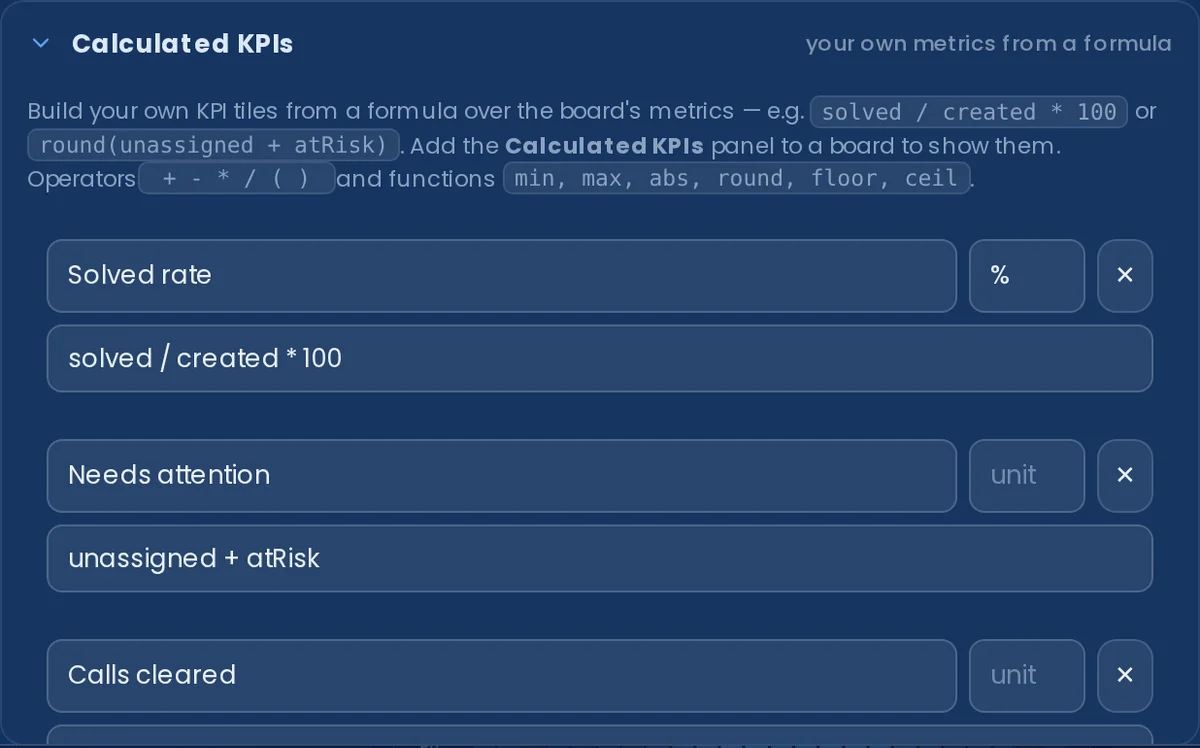
Calculated KPIs are part of Pro and Enterprise — see Plans.
Board replay (Pro)
Nexus quietly keeps a history of the board so trends survive restarts — and Board replay lets you scrub back through it. A top-bar button opens a scrubber that walks the day's backlog and unassigned curves, so you can answer "what did the queue look like at 9 this morning?" without exporting anything. It reads the same persisted history the burn-down and trend panels already use, so it adds no extra load on your help desk. Board replay is a Pro feature and, like the other top-bar tools, isn't shown on a client-scoped screen or in TV mode.
Dashboards & scheduling
Keep several named dashboards — an Ops board, a Management board, a client-facing board — and switch between them from the top bar. Each dashboard can have its own theme. A fresh board opens on the Helpdesk Glance preset — big KPIs, leaderboards and feedback, then targets, agent status, the busiest-times heatmap and service status.
A single dashboard is available on every plan. Multiple dashboards, the TV loop and scheduling are part of Pro and Enterprise — see Plans.
TV loop: loop through your dashboards on a TV so a wall cycles boards automatically. Schedule board + theme changes by time of day — e.g. a light "Ops" board 9–5, a quieter dark one overnight.

Alerts
Post to Slack, Teams or Discord with platform-native formatting when a live metric crosses a threshold. The server runs a background check every 60 seconds and fires an incoming webhook when a metric is newly breaching — or when it recovers.

Set up threshold alerts
Open ⚙ Settings → Alerts (admin only, server build). The setup takes about two minutes:
-
Create an incoming webhook in your chat platform:
- Slack: go to api.slack.com/messaging/webhooks, create a new app (or use an existing one), enable Incoming Webhooks, add a webhook to a channel, and copy the URL (starts
https://hooks.slack.com/services/…). - Microsoft Teams: in the channel, click ⋯ → Connectors → Incoming Webhook → Configure. Give it a name, copy the URL (contains
webhook.office.com). - Discord: in the server, open channel settings → Integrations → Webhooks → New Webhook. Copy the URL (contains
discord.com/api/webhooks/).
- Slack: go to api.slack.com/messaging/webhooks, create a new app (or use an existing one), enable Incoming Webhooks, add a webhook to a channel, and copy the URL (starts
- In ⚙ Settings → Alerts, paste the webhook URL into the Webhook URL field.
- Tick Send a webhook when a threshold is reached to enable the scheduler.
- Set the thresholds for the metrics you care about (0 disables a metric):
- Unassigned tickets — notify at — fires when the number of unassigned open tickets meets or exceeds this value.
- Calls waiting — notify at — fires when the real-time calls-waiting count meets or exceeds this value.
- At-risk tickets — notify at — fires when the number of tickets approaching an SLA breach meets or exceeds this value.
- Set the Re-notify cooldown (minutes) — the minimum gap between repeat notifications for the same metric while it stays breaching. This prevents a flurry of messages while a number hovers at the threshold. The default is 30 minutes.
- Optionally tick Alert when a screen drops offline — see below.
- Optionally tick Mention @here on alerts — adds
<!here>to Slack alerts and@hereto Discord alerts (Teams legacy connectors don't support at-mentions). - Click Save alert settings.
- Click Send test to immediately post a test message to your webhook channel. Confirm it arrives before relying on the alerts.
How the scheduler works: every 60 seconds the server reads the three live metrics. For each metric where a threshold is set, it applies edge-trigger logic:
- A metric is newly breaching (value just crossed the threshold) → a notification is sent immediately.
- A metric is still breaching after the cooldown has elapsed → a repeat notification is sent.
- A metric recovers (drops below the threshold) → a green "Recovered" message is posted (no @mention).
- If the metric could not be read this tick (provider error) → the breach state is preserved and no notification is sent for that metric, so a transient data read failure never silently clears an active alert.
Screen-offline alerts. With Alert when a screen drops offline ticked, the same scheduler also watches your Screen Sync screens: when a screen that was online drops offline, it posts a card naming the screen — and posts a recovery when it comes back. It's edge-triggered like the metric alerts (one message per transition), and newly-seen screens are seeded silently, so restarting the server never sets off a false alarm. Handy for a wall TV that's quietly gone dark behind reception.
Escalation. The first offline alert is informational — but a screen still offline after a stretch you choose gets a louder 🚨 follow-up naming how long it's been down, optionally repeating on an interval until it recovers. Set Escalate if still offline after (and, if you want repeats, Repeat the escalation every) under the screen-offline toggle — so a display that quietly dies overnight eventually pages someone instead of staying one polite message deep in a channel.
Smart alerts — anomalies, not thresholds. Tick Smart alerts and the board also watches its own persisted history for the statistically unusual: the unassigned queue (or the open backlog) jumping far beyond its trailing-24-hour pattern, or today's created volume way above the norm for that weekday — Mondays compare with Mondays, because support volume is weekday-shaped. There are no numbers to tune; the detector needs a few days of history to find its baseline, stays honest on quiet desks (a one-ticket blip is never "an anomaly"), and fires at most once per day per signal through the same webhook/push/notification-centre channels as your threshold alerts. With an AI provider connected, each alert card carries one line of plain-language context (what's unusual, against what baseline). Smart alerts are part of Pro and Enterprise.
Nexus auto-detects the platform from the webhook URL and sends a platform-native payload: a Slack attachment with a coloured bar, a Discord embed, a Teams MessageCard with a themeColor, or a generic {"text": "…", "content": "…"} for any other platform. Alert messages are red; recovery messages are green.
Webhook alerts require Pro or Enterprise. The webhook URL is stored in the encrypted secrets store (not in plain settings.json) so it is protected by the same AES-256-GCM / DPAPI encryption as your helpdesk token.
End-of-day digest
In addition to threshold alerts, Nexus can post a daily summary to the same webhook at a scheduled time. Configure it in ⚙ Settings → Alerts, below the threshold section:
- Tick Send a scheduled end-of-day digest 📊 to enable it.
- Set Send at (HH:MM) — the time in your business timezone (configured in ⚙ Settings → Data & API → Business hours) at which to send the digest.
- Click Save digest.
The digest is sent once per calendar day in your business timezone, within a 2-hour catch-up window after the target time (so a brief server restart shortly after the scheduled time doesn't miss it). It includes: tickets solved and created today, CSAT score (if available), top solver (name + count), total calls today, and the count of open unassigned tickets. With an AI provider connected (Settings → AI summary), the digest opens with a one-sentence read of the day before the numbers; without one it reads exactly as before.
The digest uses the same webhook URL as threshold alerts — you only need to set the URL once. Digests require Pro or Enterprise.
Email it too. Tick Also email the digest and add up to ten recipients to have the same end-of-day summary delivered as a branded email — the same clean layout as the scheduled daily report, with your logo and accent colour, sized for a quick read on a phone. The webhook payload is unchanged, so anything already parsing it keeps working; the email rides alongside. Either channel can run without the other — a webhook URL isn't required for the emailed digest.

War-room SLA takeover: an opt-in full-screen red alert takes over the board when a ticket is within 30 minutes of breaching its SLA target. It's snooze-able and auto-clears once the risk passes. Time-scoped panels also show live SLA breach countdowns. The SLA war-room is an Enterprise feature.
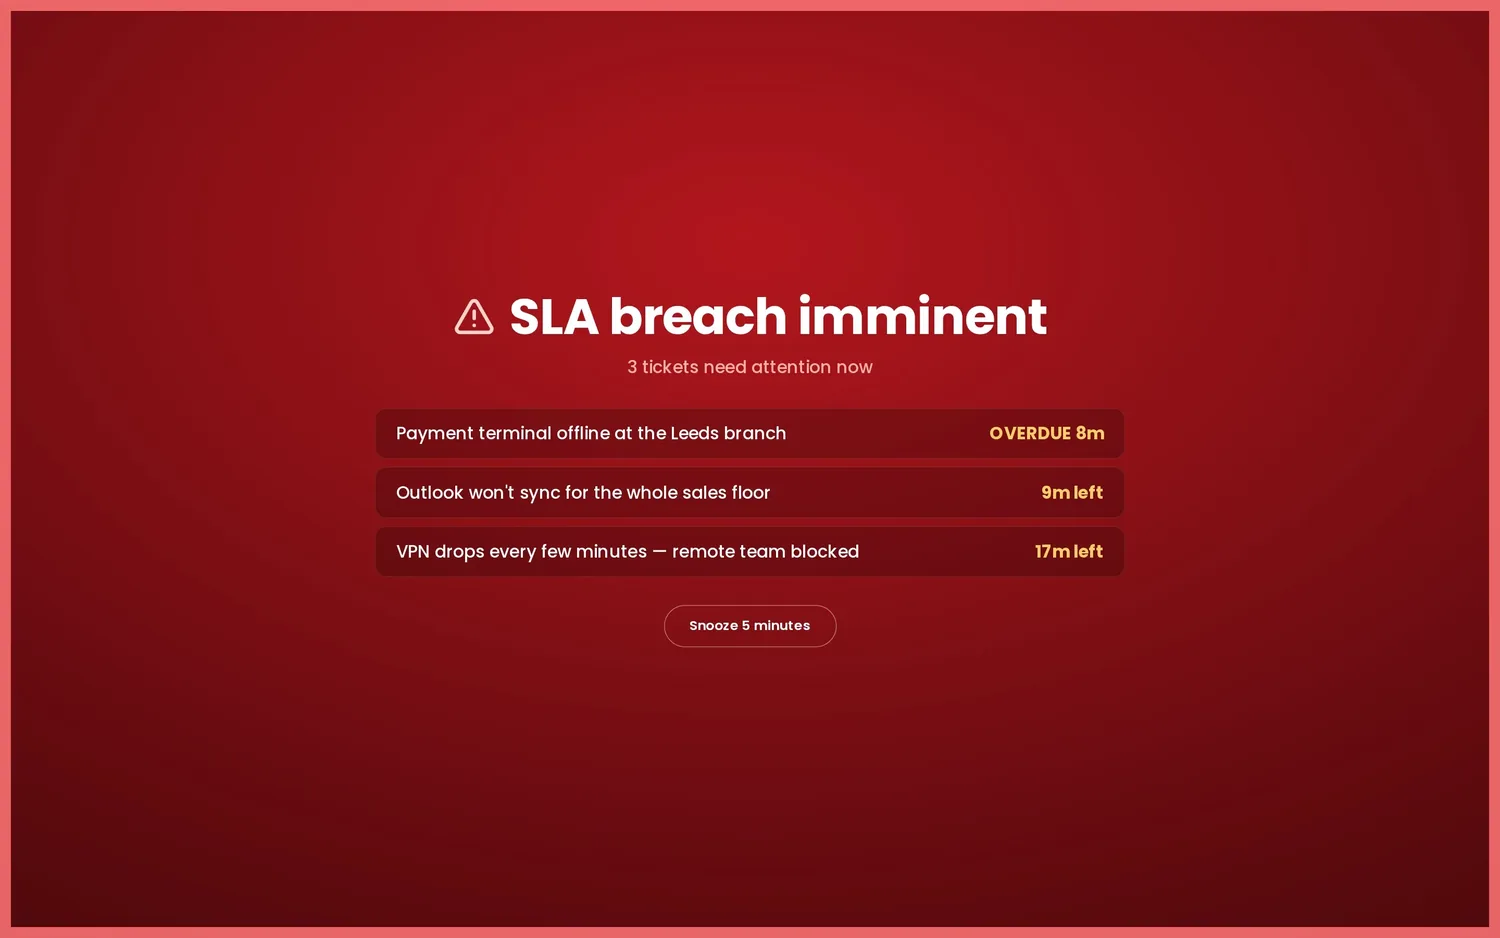
Ambient alerts: sound alerts for key events; an announcement ticker for team-wide messages; a critical-alert glow that pulses a red edge around the whole board.
Webhook alerts and scheduled digests are part of Pro and Enterprise; the business-hours First Response and SLA war-room are Enterprise. See Plans.
Mobile push alerts
The same threshold, smart-anomaly and screen-offline alerts that post to your chat webhook can also be delivered to phones as native push notifications — so the team is nudged even away from the wall screen. Push is a second, best-effort channel that rides alongside the webhook (the webhook stays the system of record); enable it in ⚙ Settings → Alerts → Mobile push and set a notification title so a glance tells which board fired.
A self-hosted board has no push credentials and often isn't reachable from the internet, so — like the emailed report — delivery is handled by the Nexus licence service: phones register their token there, and the board posts each alert to it for fan-out. Native Android & web go via Firebase (FCM) and iOS via Apple (APNs). In the Nexus mobile app, one tap on Register this device sources the token from the OS and registers it; a Send test push button confirms it arrives.

Mobile push is part of Pro and Enterprise — see Plans.
Notification centre
Everything the board wants you to know now lands in one place: a bell in the top bar with an unread badge. New events pop up top-centre for up to 30 seconds and then file themselves into the bell's history, so a popup you missed is never gone — click any entry (the popup, the history row, or an OS notification on the apps) to open its details view with the full story and timing.
What arrives there: threshold alerts and recoveries, wallboard screens dropping offline (and coming back), tickets approaching or breaching SLA, announcements, goals reached, daily report sent, connector problems, and security events — a password reset, a new account, a role change. Notifications respect access levels: security events go to admins only, report events to managers and up, and the operational rest to everyone signed in.
On the desktop and mobile apps, fresh entries are also mirrored to the operating system's notification surface (where you've allowed it), so "board offline" can still reach you when the board isn't on screen — and tapping one opens that entry's details on the board. A plain browser tab keeps everything in-app.
On your terms. The gear in the panel's header opens this device's notification preferences: per-type toggles for the popups and the system-tray mirror, plus popup quiet hours (overnight windows wrap midnight). Preferences only govern the interruptions — everything still lands in the history and counts on the badge — and they're per device, so the wall TV can stay silent while your laptop pings. The details view also grew a button that jumps straight to the right place: an SLA warning opens the at-risk tickets, a screen alert opens Settings → Screens, a report notice opens the Reports studio. A clear button empties this device's locally-recorded entries.

Scheduled emailed report
Have Nexus email a daily PDF board report at a time you choose — today's solved, created, CSAT, calls, open unassigned and the top solver. The board has all the figures but no mail server, and a LAN-only install often isn't internet-reachable, so it builds a structured report and the licence service renders it to a branded PDF and sends it — no SMTP needed on the board itself. Set it up in ⚙ Settings → Alerts → Emailed report: tick to enable, choose the send time (in your business timezone) and add up to ten recipients.

The scheduled emailed report is part of Pro and Enterprise — see Plans.
Reports studio
When you want a report now — for a client review, a one-to-one or a monthly wrap-up — open the Reports button in the top bar. Pick who it covers (the whole desk, one team, one agent or one client), the timeframe (today, this week, the last 7/30 days or this month), which sections to include (overview KPIs, created-vs-solved chart, leaderboards, CSAT by agent, workload mix, quality signals — and the newer narrative and comparison sections below) and an accent colour — then watch the live A4 preview and hit Download PDF.
Every page carries your uploaded logo and board title (Settings → Appearance), so what you hand a client looks like your report, not ours. The PDF is assembled entirely in your browser — nothing is sent anywhere to be rendered — so it works the same on an offline or LAN-only board. Team and agent reports recompute solved counts, handled counts and CSAT from that team's or agent's own rows; anything your helpdesk only reports desk-wide is clearly labelled "whole desk" on the page rather than passed off as team figures.

Presets. Dialled in a report you like? Type a name under Presets and save it — scope, timeframe, sections and accent together, one click to re-apply next time. Presets are saved on the device (up to twelve), so the boardroom laptop and the ops desk can keep different favourites.
Executive summary (AI-assisted). The Executive summary section opens the report with a short written narrative of the figures on the page. With an AI provider connected (Settings → AI summary — the same engine as the Daily Summary panel) it's AI-written from exactly the numbers being printed, never anything else; without one it falls back to a clean templated paragraph, so the section works on every install. Nothing is stored, and no free text leaves the board beyond the labels already on the report.
Security posture. The Security posture section adds per-client monitoring health to the PDF — device issues and status from every monitoring vendor you've configured (UniFi, Meraki, Acronis, Huntress and the rest) — turning a support report into the security-and-service wrap-up an MSP hands a client. Boards with no monitoring vendors simply don't get the section.
Insights & feedback themes (AI-assisted). Two more sections that write themselves: Insights turns the period's figures into 3–5 observation bullets — the busiest day, whether the desk kept ahead of demand, satisfaction drifting — AI-written with a provider connected, rule-computed without. Feedback themes reads your recent CSAT survey comments and clusters what customers keep saying into a handful of named themes with counts (and always shows the plain 👍/👎 tally with recent quotes, AI or not).
Trends & comparison, and Response & SLA. Trends & comparison sets this period's created volume and CSAT against the equivalent previous period, and draws a 12-week created-vs-solved trail from the board's own persisted history. Response & SLA prints the average first reply beside the tickets at SLA risk right now, so the report says how fast — not just how many.
Manager's notes. Tick the Manager's notes section and a text box appears in the studio — your own paragraph, printed on the report as its own section. It's the difference between a generated report and an authored one. Scheduled reports carry a notes field too, so the standing month-end pack can open with your standing commentary.
Client packs (QBR). Choose A client as the scope and the report becomes a customer-facing pack for one organisation: tickets they raised and you solved this period (counted from their own tickets, never desk figures), what's open for them right now, a ticket log, their security posture, the executive summary — and your notes. Desk-internal sections (leaderboards, workload mix, desk trends) aren't just unticked, they're structurally excluded from client packs, so nothing desk-wide can leak into something you hand a customer. The ✨ QBR pack preset chip sets the whole thing up in one click, and scheduled reports accept the same scope for a month-end client pack that emails itself.
The report archive. Every scheduled or daily report PDF the server emails is also kept on your server (the newest 30 by default; set the depth — or 0 to switch it off — via reportArchiveKeep in settings), listed under Archive in the studio for one-click re-download. It's the exact PDF that went out — rendered once, filed as sent — for the auditor, the new manager, or "what did we send Acme in March?"
The Reports studio is part of Pro and Enterprise — see Plans. Per-team scoping uses your helpdesk's agent groups (Zendesk, Freshdesk, Freshservice, Zoho Desk, Help Scout, Front — and demo mode); client packs use your helpdesk's customer organisations.
Ask the board (Pro · AI)
The question-mark button in the top bar opens a small Q&A box: type "who solved the most tickets this week?", "which client has the biggest queue?" or "how does this week compare to usual?" and get an answer in a sentence or two, written from your desk's own figures. It uses the AI provider you've connected (Settings → AI summary) and is deliberately not a free-roaming agent: the model's only move is to pick one metric from a fixed menu (solvers, clients, CSAT, call volume, the queue, SLA risk…); your server runs that query with hard caps, and the answer is written from the returned data alone. Ask something the board can't measure and it says so rather than guessing. Nothing is stored, and the data involved is the same board data your screens already show. Available to managers and admins on Pro and Enterprise.
Ask from Slack. The same guarded Q&A can answer a Slack slash command, so the team can ask without opening the board. Create a Slack app with a slash command (for example /ask), point its request URL at <your-server>/api/ask/slack, and paste the app's signing secret into ⚙ Settings → Data & API → Slack — Nexus verifies every request genuinely came from Slack before answering, and with no secret set the endpoint stays closed. Answers come from the same fixed-menu model with hard caps; anyone in that Slack workspace can ask.
Scheduled reports
The studio's reports can also send themselves. Under ⚙ Settings → Alerts → Scheduled reports, save up to eight recurring reports — each with its own name, scope (whole desk, one team, one agent or one client — the auto-emailed QBR pack), accent colour, cadence, optional notes paragraph and recipients — and the server emails each one as a branded PDF on its schedule: a daily report covers that day, a weekly one (pick the weekday) covers the week, a monthly one (pick the day, 1–28) covers the month. Times use your business timezone, and like the daily report the rendering and delivery are handled by the licence service, so no mail server is needed on the board.
Scoped scheduled reports follow the same honesty rules as the studio: a team's solved and CSAT figures are recomputed from that team's own rows, a client's counts come from that client's own tickets, and anything your helpdesk only reports desk-wide says so on the page. Think "Monday-morning ops report to the team leads" or "month-end client wrap-up to the account manager" — set once, arrives forever. Delivered PDFs are also filed in the report archive.
Post to Slack & Teams too. Each scheduled report has an Also post the numbers to the alerts webhook toggle: when it fires, a compact card — period, scope, headline KPIs, top solver — lands in the channel your alerts already use. Works alongside the emailed PDF, or on its own for a channel-only report (leave the recipients empty).
Scheduled reports are part of Pro and Enterprise — see Plans.
Team scope
Running screens for one team rather than the whole desk? Pick the team in the setup wizard (Team step) or under ⚙ Settings → Panels → Team scope, and a screen's agent panels — presence, both leaderboards, top solvers, CSAT by agent and customer feedback — follow that team's members. Board-wide totals (tickets, calls, trends) stay whole-desk, and a chip in the top bar names the team so a scoped screen can never be mistaken for the full desk. Teams come live from your helpdesk's agent groups; if a group is later deleted there, the board fails open to everyone rather than going blank.
Per screen, with a board default. The wizard sets the board default — what every screen shows out of the box — and each screen can then follow its own team: reception on Service Desk while the NOC wall shows Network & Voice. Set it on the device under Team scope → This screen, or pin it in a TV's launch URL with ?team=<id> — the same pattern as ?screen=<name> for its identity.
Every team gets its own goal. The same section holds per-team daily goals: give each team a solved-today target and any screen scoped to that team aims its Solved vs Target and Team Goal panels — and the goal celebration — at the right number, counted from that team's own tickets (0 falls back to the board-wide target). And the Team Comparison panel puts every team side by side — tickets solved over the board's timeframe, volume-weighted satisfaction and who's online right now — sorted by solved, so a manager's screen answers "how are the teams doing?" at a glance. Enable it under Settings → Panels.
Follow the sun. Running 24×7? Add shift windows in the same section — from 22:00 to 06:00 show the overnight team, from 06:00 to 14:00 the early shift — and the board default switches with the active shift by itself (windows may wrap midnight; hours outside every window use the normal board default, and a screen's own scope always wins). Handovers stop needing anyone to touch the wall.
Contests (Pro)
Turn the leaderboard into a proper competition. Under ⚙ Settings → Panels → Contest, pick what counts (tickets solved, replies sent or calls answered), the period (a daily sprint, this week or this month) and the prize — then add the Contest panel to the board. It shows the podium with a live countdown to the period's end, and when the clock runs out the board fires a winner celebration, once, with the prize on screen. Contests ride the leaderboard data the board already has, so they cost nothing extra against your helpdesk's API.
Tracked date & week start
Measure from a date that matters. Under ⚙ Settings → Panels → Tracked date, set one date — quarter start, a product launch, the day you migrated — and every range picker (the board's, each panel's override, and the Reports studio) gains a Since option that measures from exactly there. Clear the date and the option disappears again; a screen that still had "Since" selected quietly falls back to "This week" rather than erroring.
Weeks that match your rota. Under ⚙ Settings → Localisation, choose which day your week starts on (Monday, Sunday, Saturday or Friday). The "This week" range everywhere — panels, leaderboards, reports — follows it, so a Sunday-opening desk isn't judged against a Monday-shaped week.
Client Health (panel)
The MSP "who's on fire?" board: one panel listing every customer organisation with its open-ticket count from your PSA joined with its monitoring health — device issues and status matched by client name across every monitoring vendor you've configured. Sorted worst-first (down beats warning beats a big queue), so the account that needs a call today is always at the top. Enable it under Settings → Panels; the monitoring column simply stays neutral on boards with no monitoring vendors.

Team scope is available on every plan, wherever your helpdesk exposes agent groups (Zendesk, Freshdesk, Freshservice, Zoho Desk, Help Scout, Front — and demo mode). It's a display preference, distinct from Enterprise client-scoped access links, which isolate a customer's data server-side.
Staff clock kiosk (Enterprise)
Stand a tablet by the door and let the team clock themselves in and out. The staff clock opens as a pop-up on the board — like Switchboard — and can be locked full-screen on a wall-mounted iPad or Android tablet. It shows a wall of names and photos, drawn from your connected helpdesk's agents where it has them and topped up with anyone you add by hand; a team member taps their face to clock in or out. An optional wallboard panel then shows who's on today, and where.
Three ways to be on. Someone can mark themselves on site — out on a customer visit — or remote from any device: their phone, a laptop, the board itself. In the office is treated differently: it can only be set from a tablet you have registered as an office kiosk, so "in the office" on the board means a person actually tapped in on the office device rather than claiming it from home. That gate is a credential the device is issued when you register it — a soft integrity check to keep the office count honest, not a network lock.
First-run setup (admin). The clock stays closed until an admin sets it up. On first open it asks for a new admin PIN; from then on that PIN both registers each office tablet (open the clock on the device, enter the PIN once, and it's remembered as a clock-in device) and unlocks the settings. There is nothing to operate on an unset-up server, so a stray device can't wander into the clock.
Settings, behind the PIN. An admin-only menu — sectioned like the app's own Settings — manages people and photos (add anyone not in your helpdesk, with a picture), registered devices (review and revoke them) and appearance, and can lock the kiosk full-screen so a public tablet stays on the clock and nothing else. Everything beyond reading the current state is PIN-protected, and repeated wrong PINs are rate-limited.
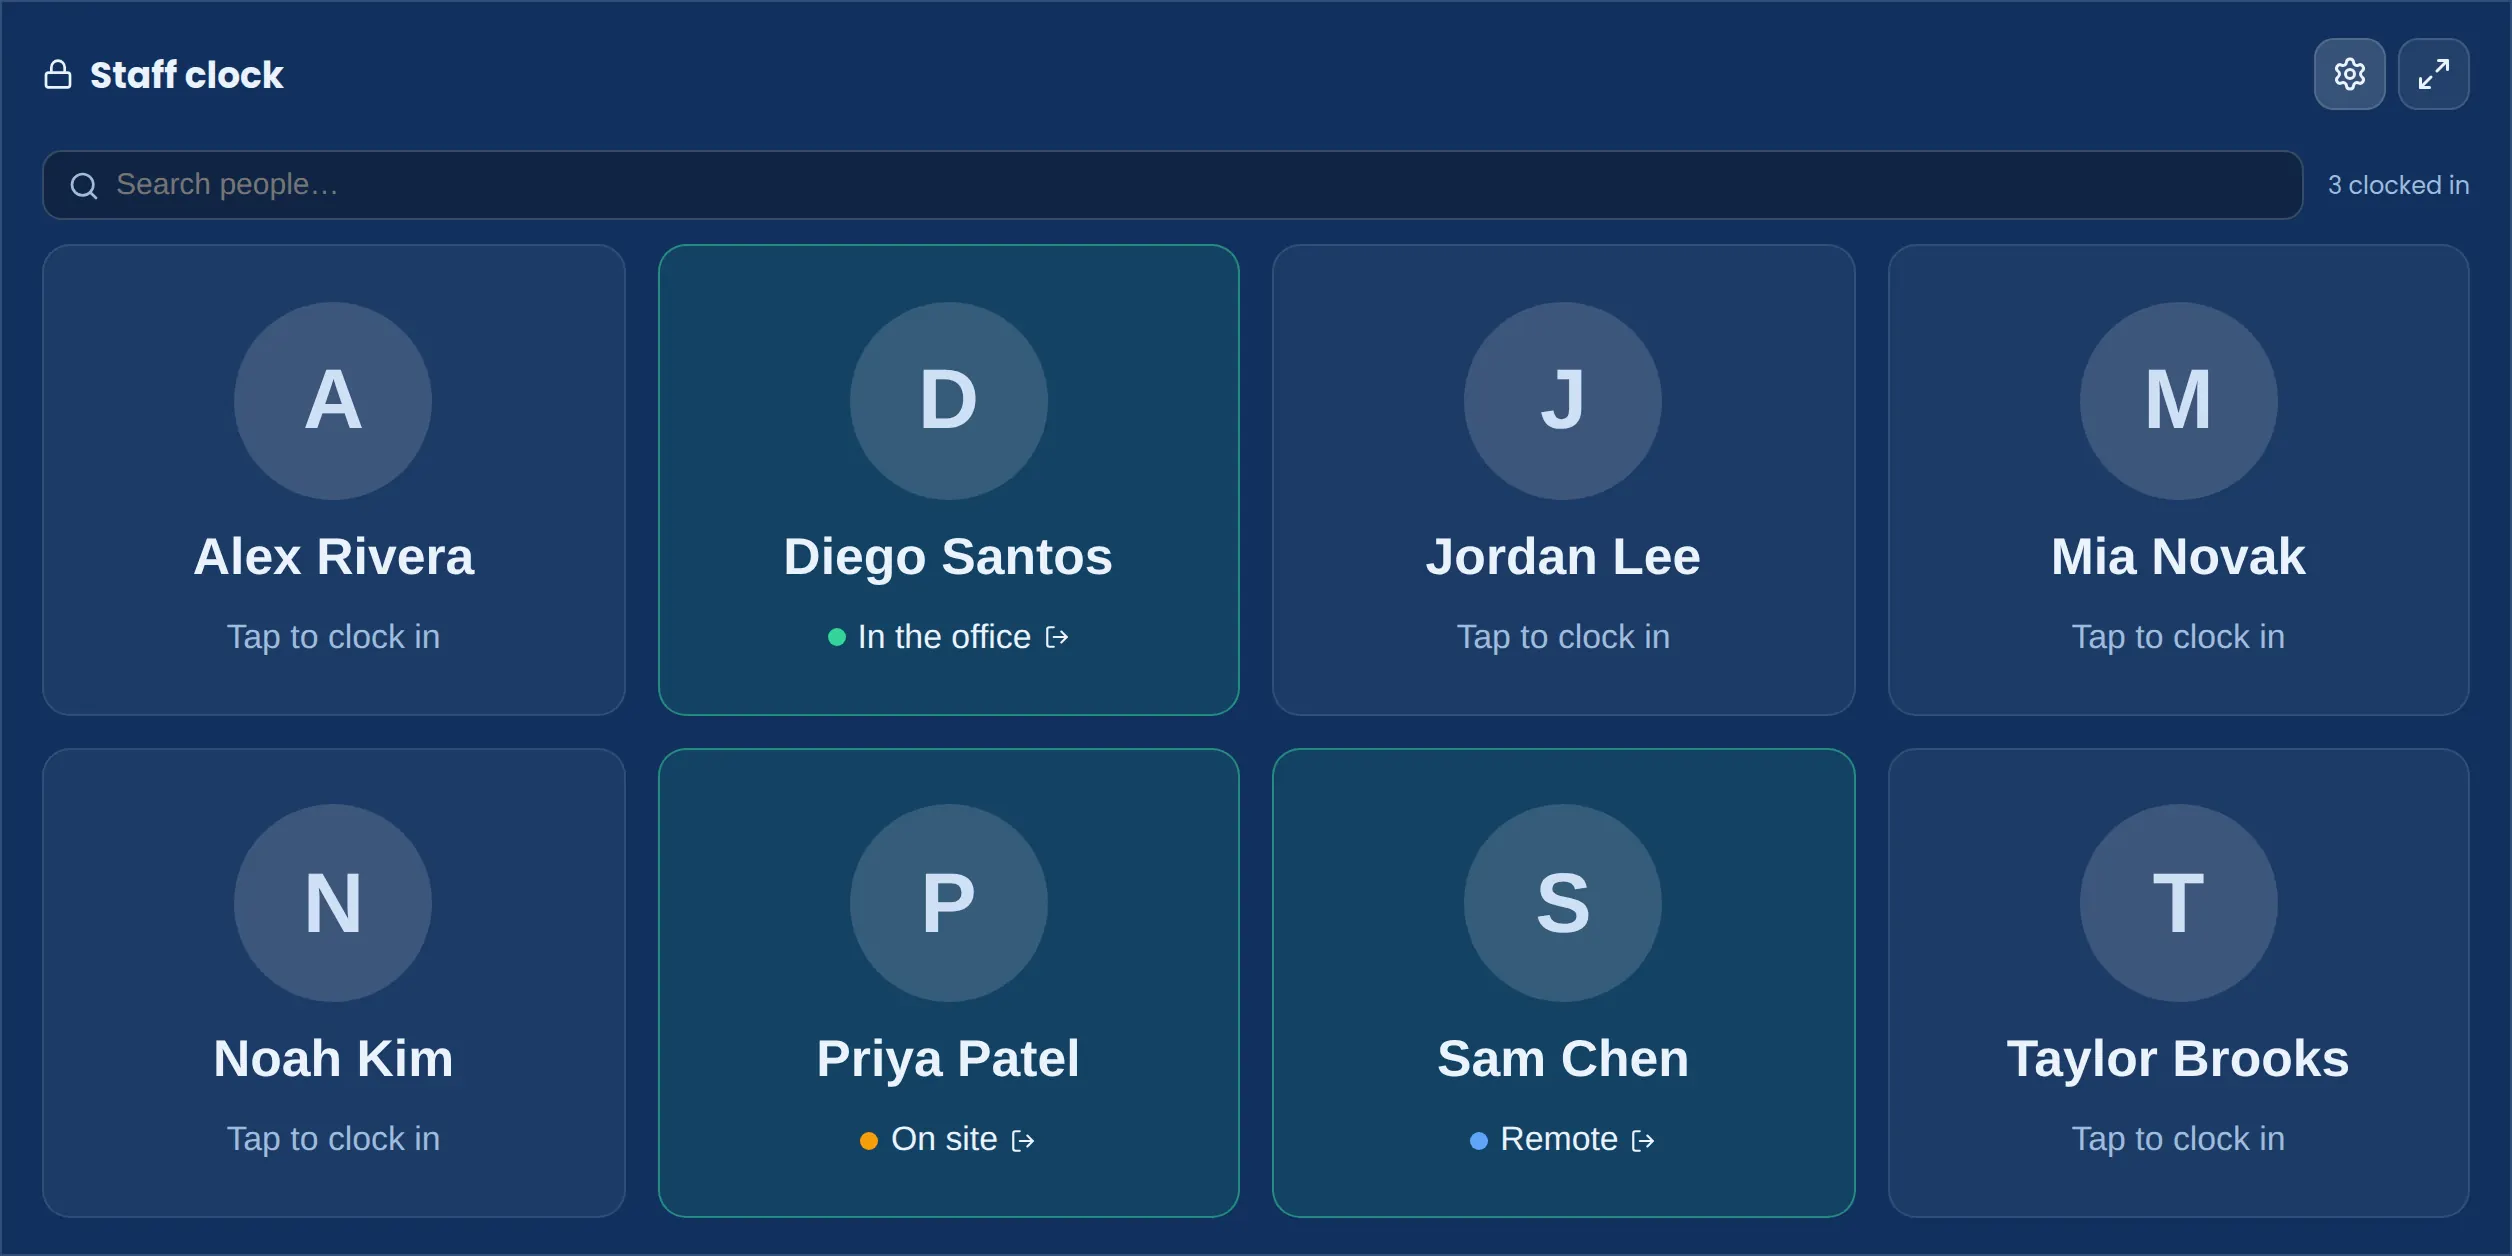
The staff clock is an Enterprise feature. On site and remote are self-service from any device; only a registered office kiosk can mark someone in the office. People and photos you add are stored on your own server alongside the rest of your board state — nothing leaves your infrastructure.
Themes, looks & TV mode
Nexus ships 11 themes, applied across the board and its menus — not just the panels. Pick one that suits the screen and the lighting in the room. Theme is part of per-device state, so a wall TV, a desk monitor and a phone can each use a different one. You can also give each named dashboard its own theme, and schedule a theme change by time of day.
A theme sets the colour; a look sets the surface. Choose from six looks under Settings → Appearance — Classic (the original frosted glass), Flat (bold solid tiles), Elevated (lifted cards with depth), Glass (frosted blur), Contrast (clean, high-contrast borders) and Nexus Cascade (an all-out, animated aurora look). Looks are independent of themes, so any look pairs with any theme, and — like themes — a look can be set per screen or pinned to a named dashboard.
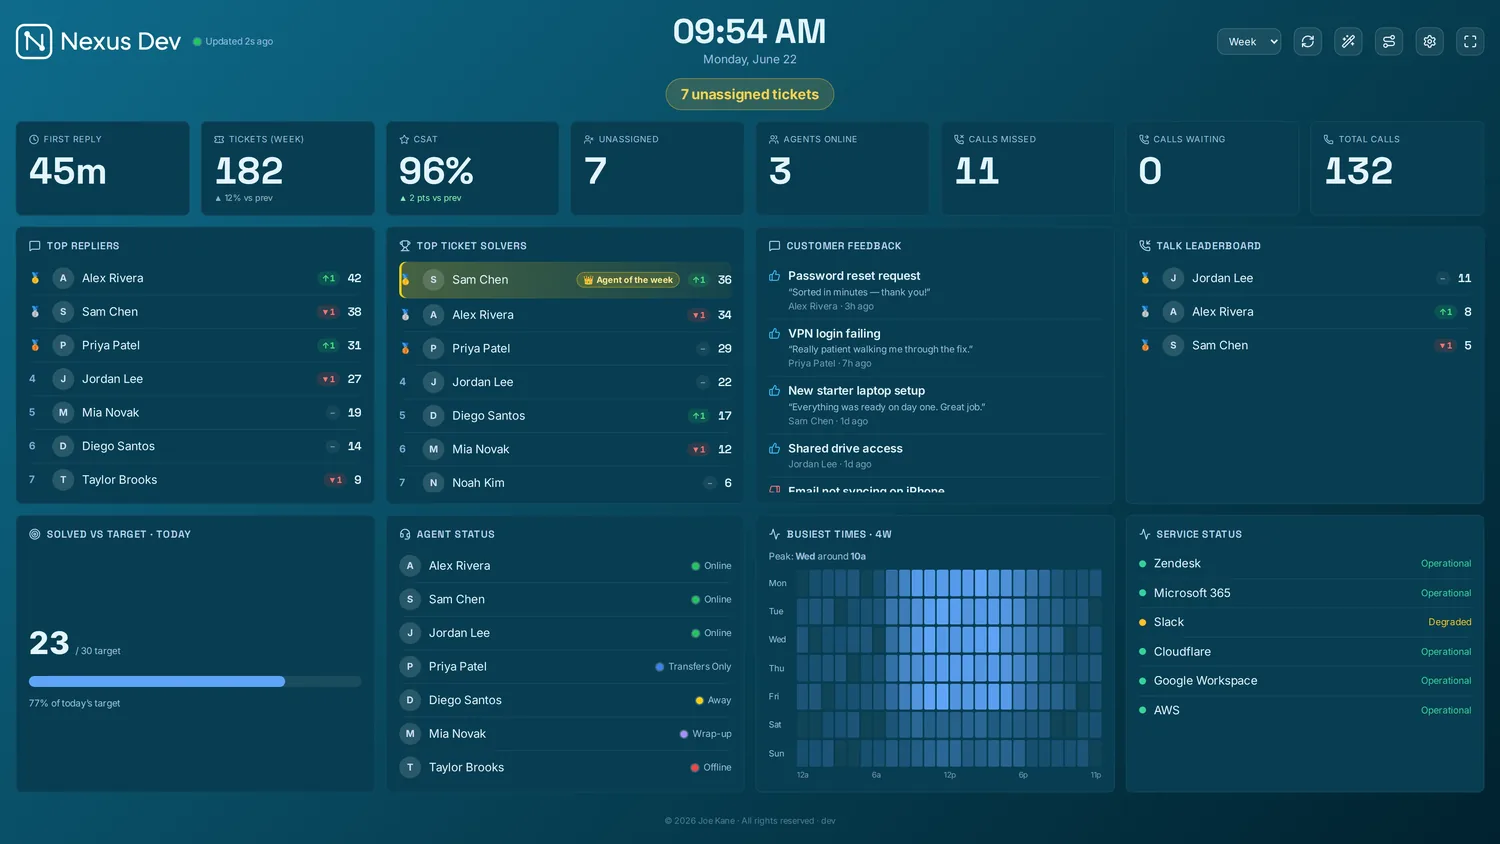
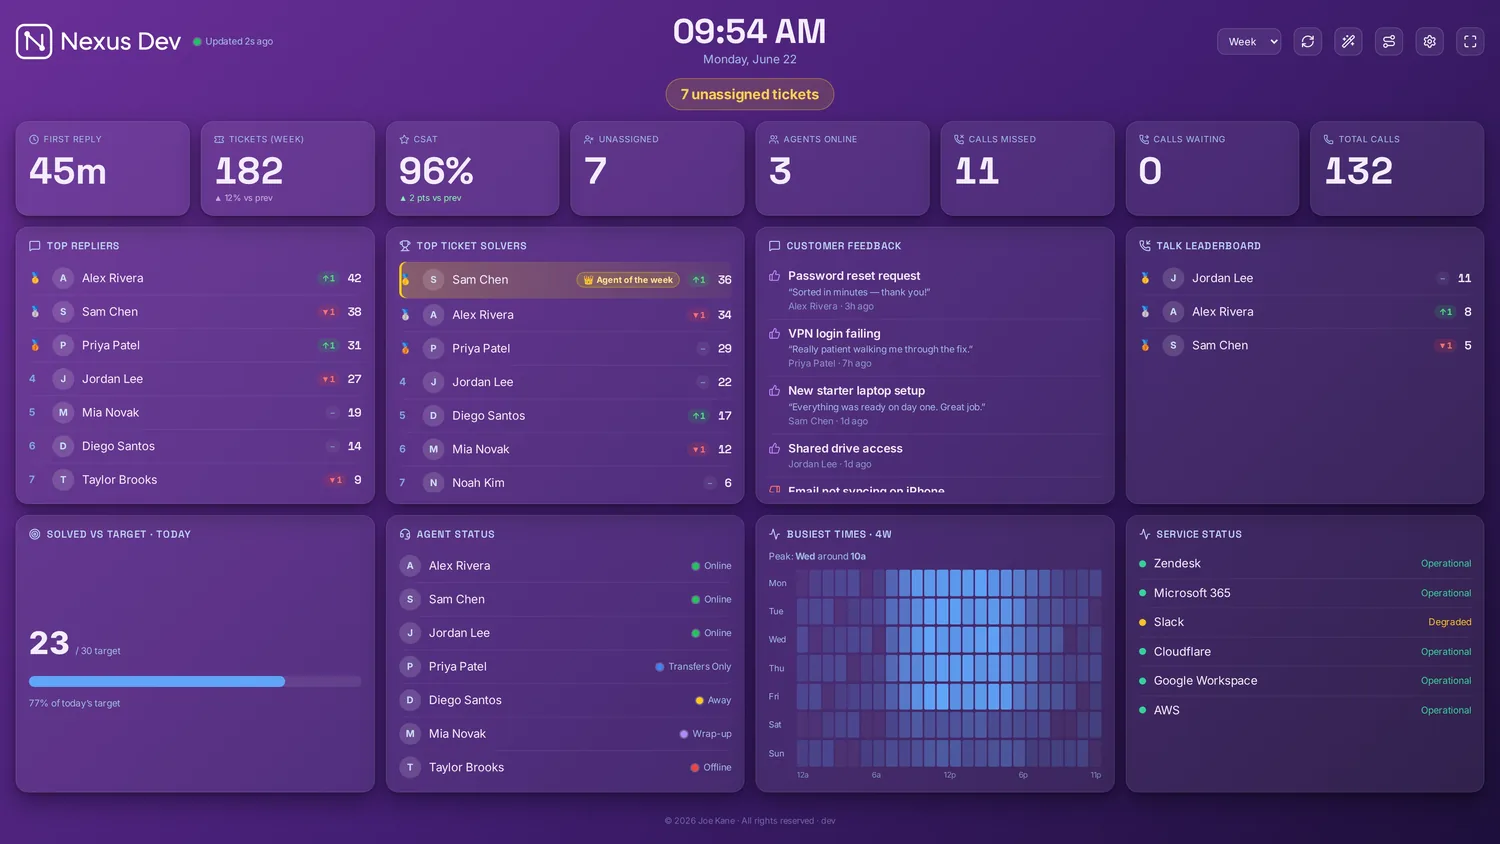
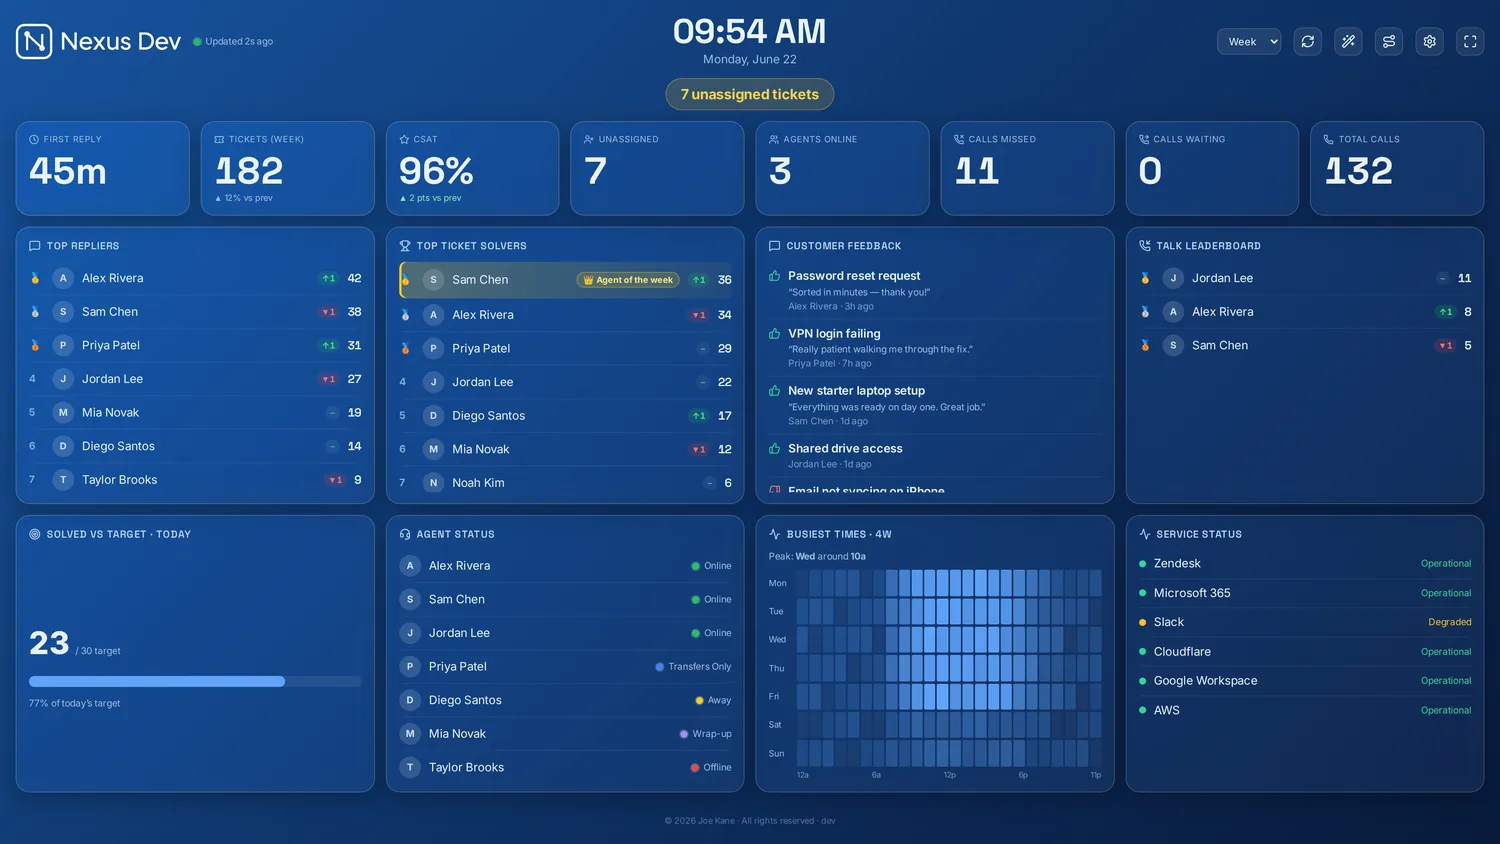
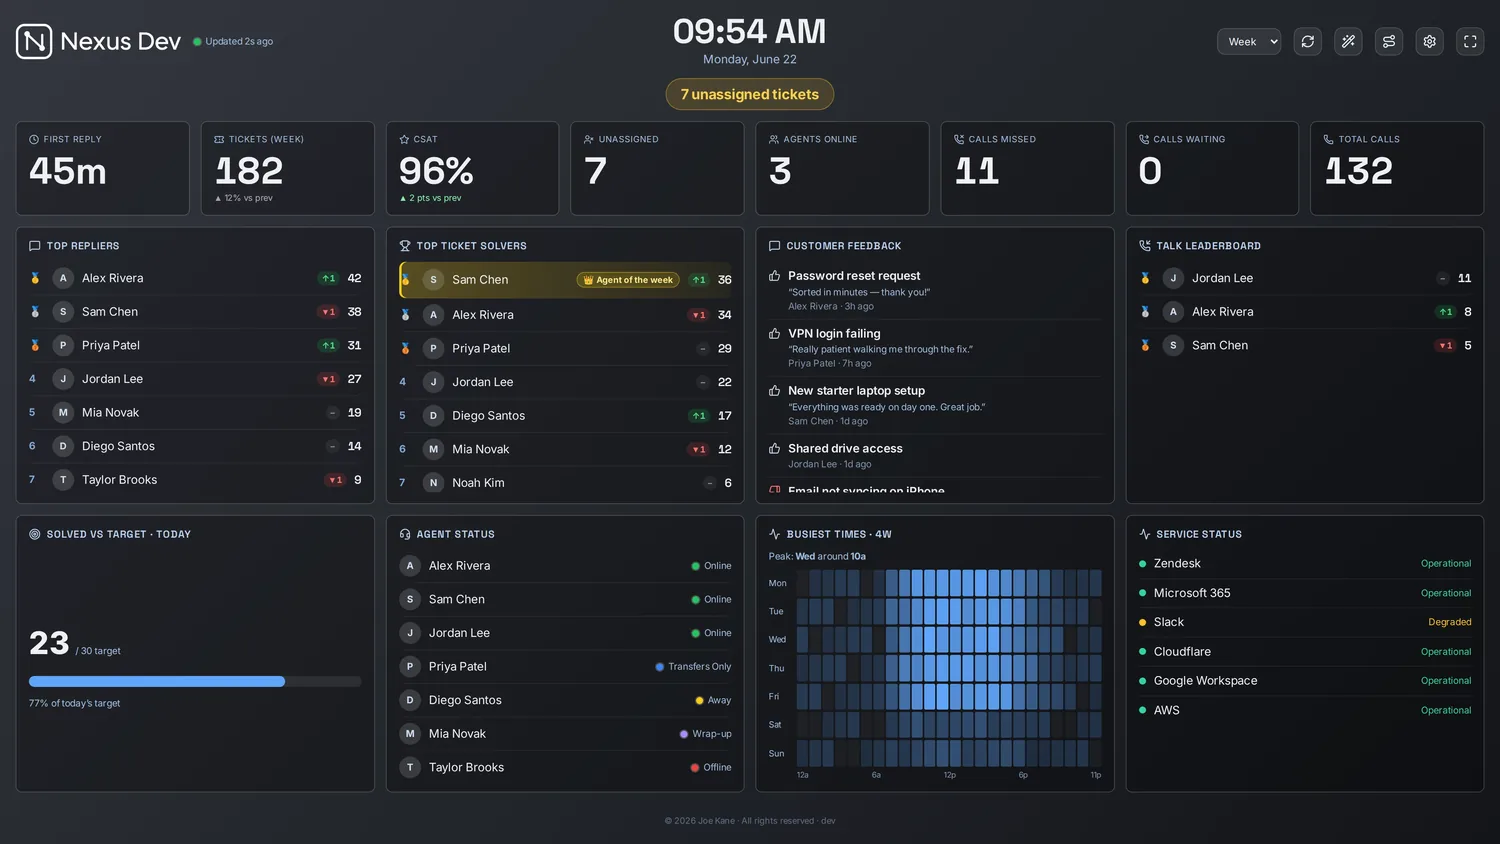
Four of the six looks above (on the Midnight theme) — pick the surface that reads best in your room's lighting, then pair it with any of the 11 colour themes.
Nexus Cascade
Nexus Cascade is the all-out look: a living, drifting aurora backdrop with deep, glassy panels — built for a hero wall where the board is the centrepiece, not the desk monitor you're working over. Set it per screen under Settings → Appearance → Look, like any other look. If the motion is distracting, Calm (Settings → Appearance) stills the aurora while keeping the Cascade surface.
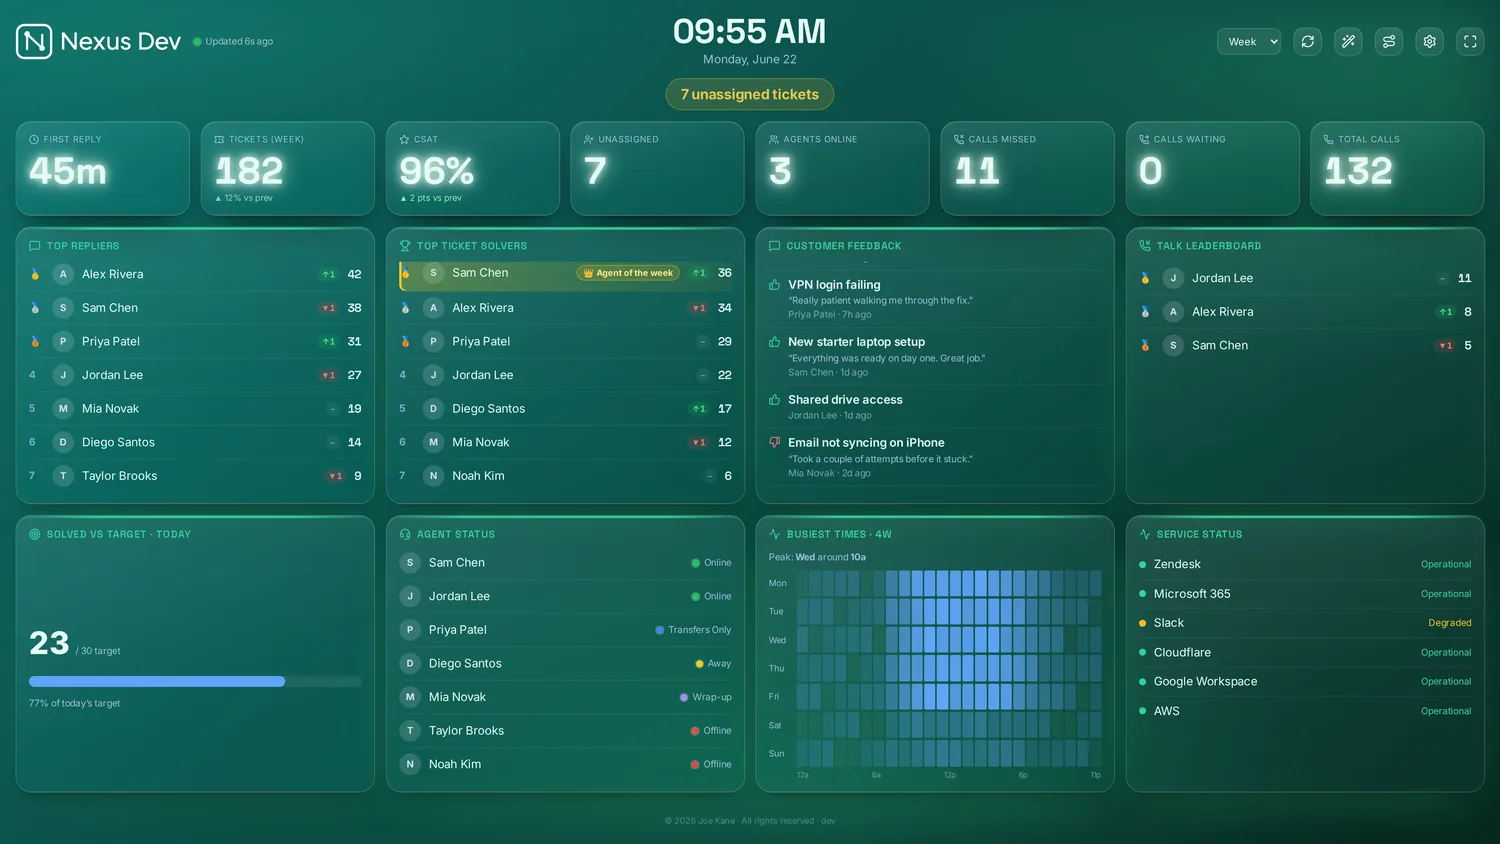

Designs — full personalities
A theme sets the colour and a look sets the surface; a Design sits above both and changes the board's whole personality. Each one is a complete board, not just a skin: it owns the background and its texture, the panel shapes, the typography (friendly rounded, editorial serif or an industrial monospace) and its own layout — which panels show, the column count, and the size of the headline numbers. Pick one under Settings → Appearance → Design and the whole board switches in a click; everything stays adjustable afterwards, and a design can be set per screen or pinned to a named dashboard, with Auto falling back to the screen's own. Every design still mixes freely with all 11 colour themes, which is a combination no other wallboard offers.
- Standard — the stock Nexus look; nothing changed.
- Bento — modular, rounded cards with soft depth; a hero trend and a CSAT band.
- Loud — a sparse, cinematic scoreboard: a few oversized numbers and one hero chart on near-black.
- Status Board — flat tiles, huge RAG numbers and a coloured rail on every panel, built to be read across a room.
- Control Room — a dense six-column industrial NOC: monospace figures, a signal palette, a faint grid.
- Aurora — luminous gauges and goals around a tall trend, on a drifting glow.
- Studio — refined and editorial: serif headings, thin rules, a calm summary-led overview.
- Mono — high-contrast monochrome on graph paper, for projectors, e-ink and maximum legibility.
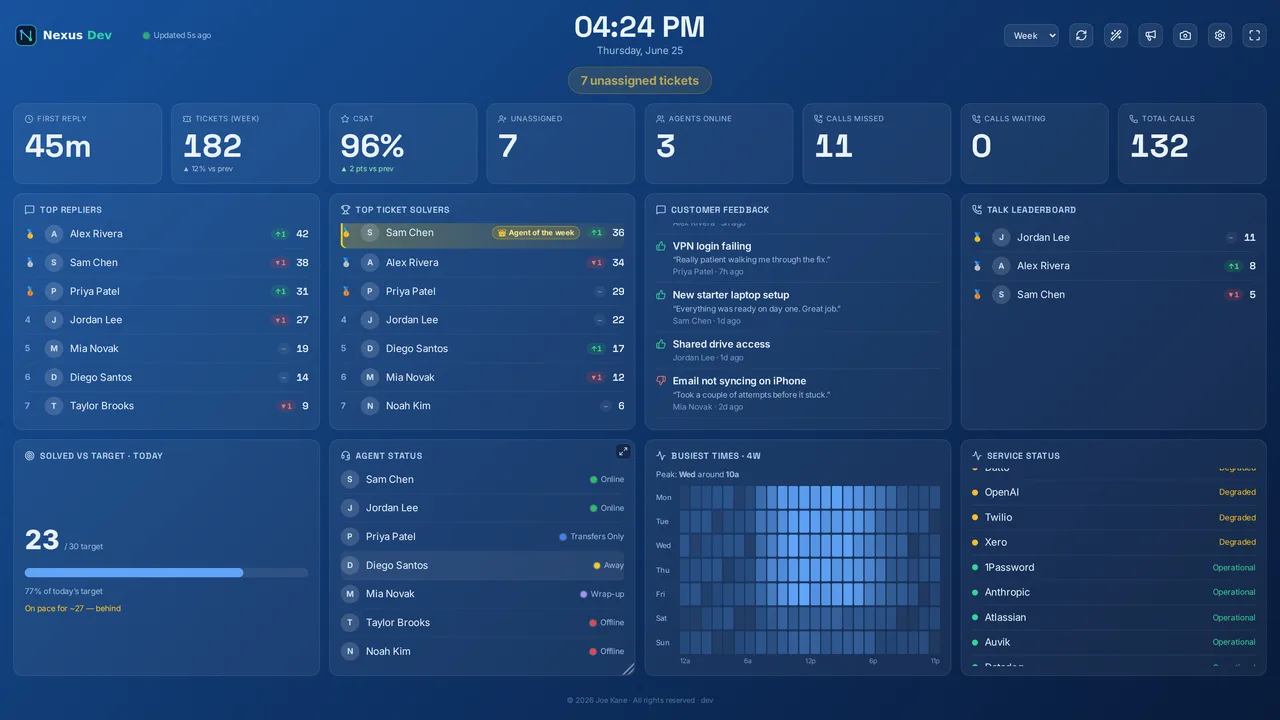
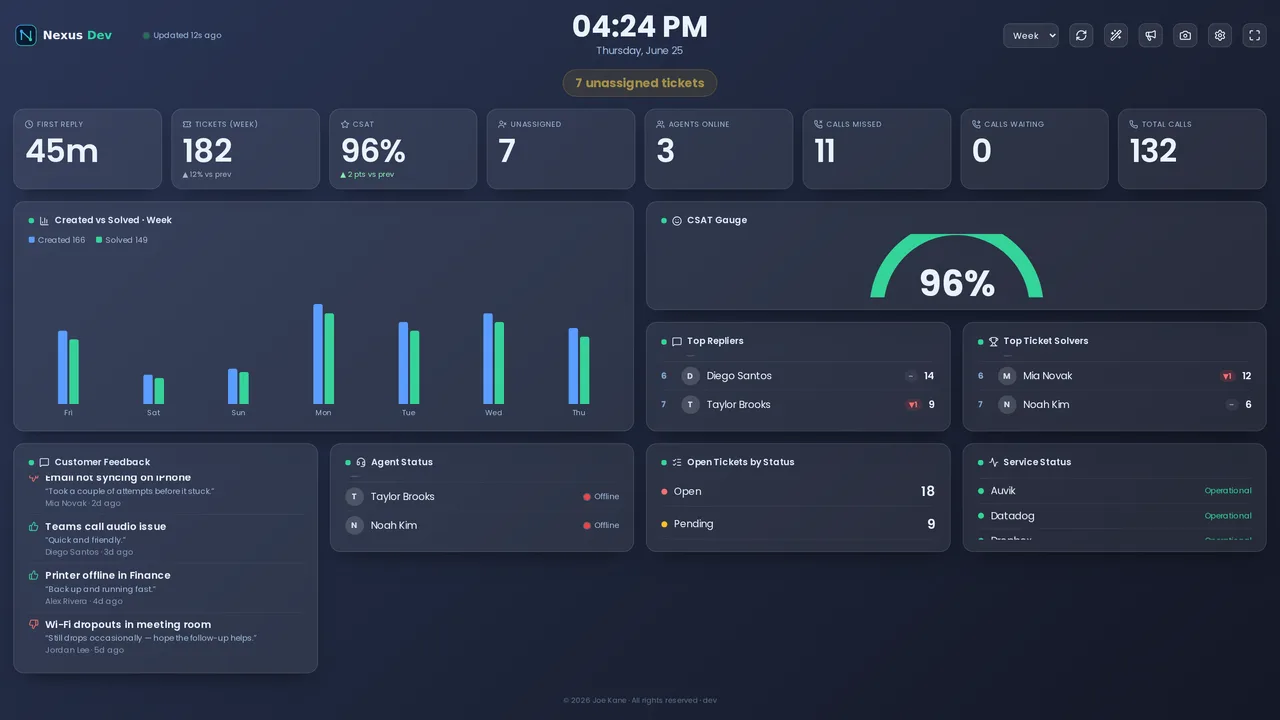
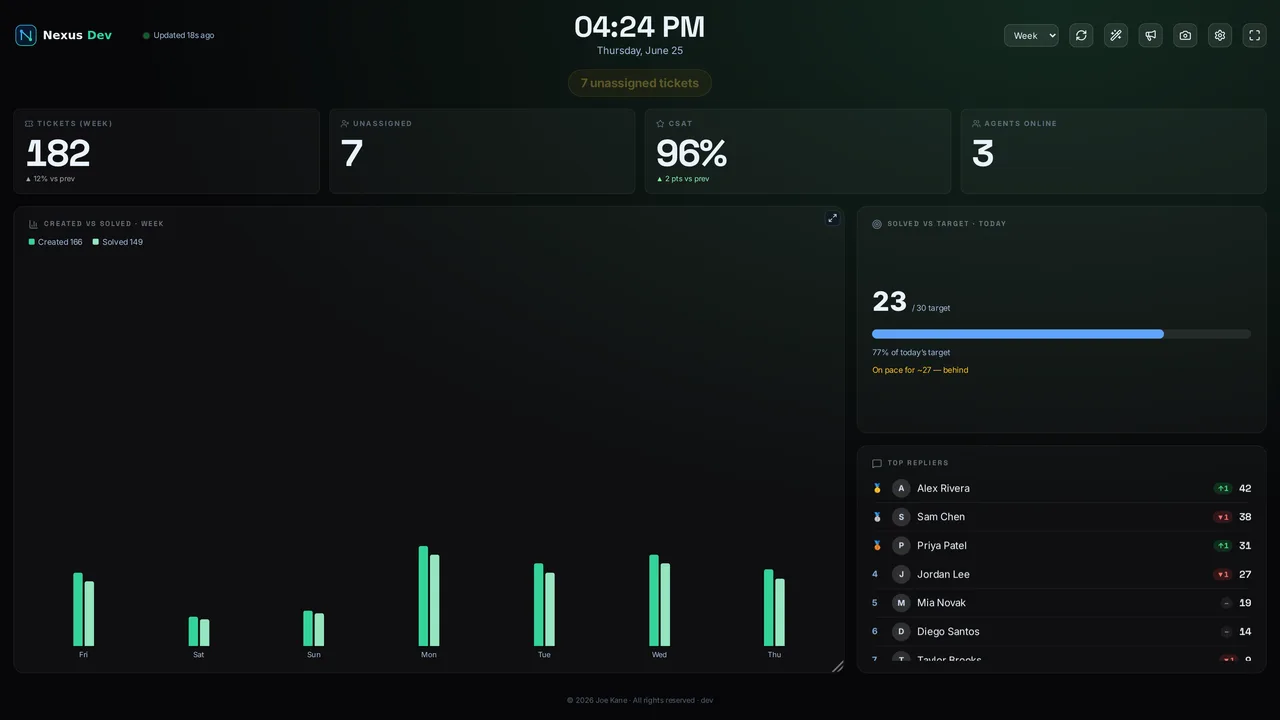
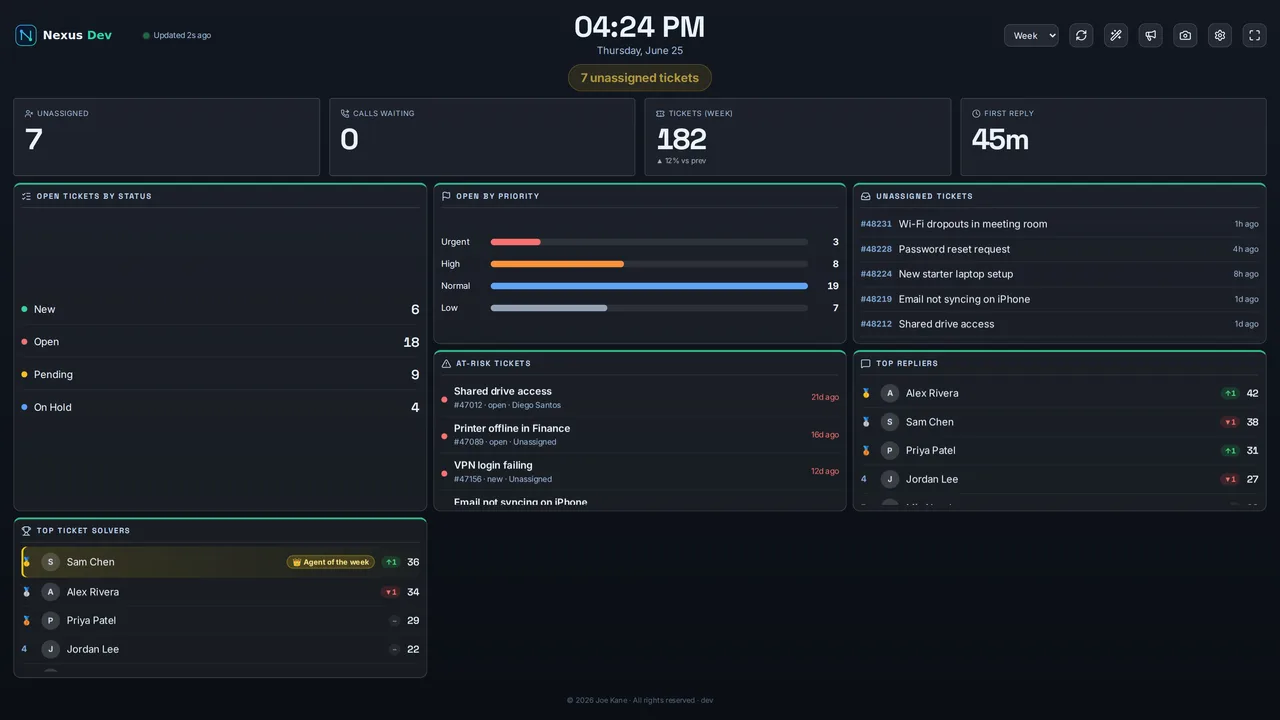
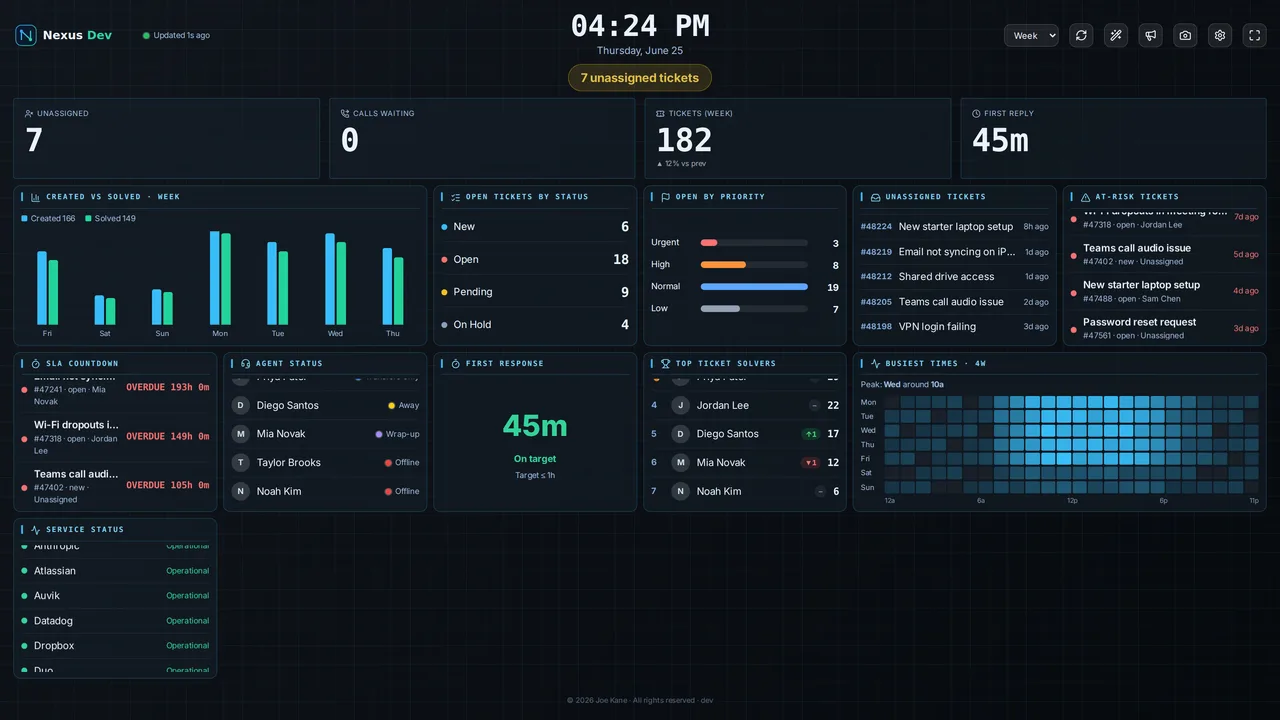
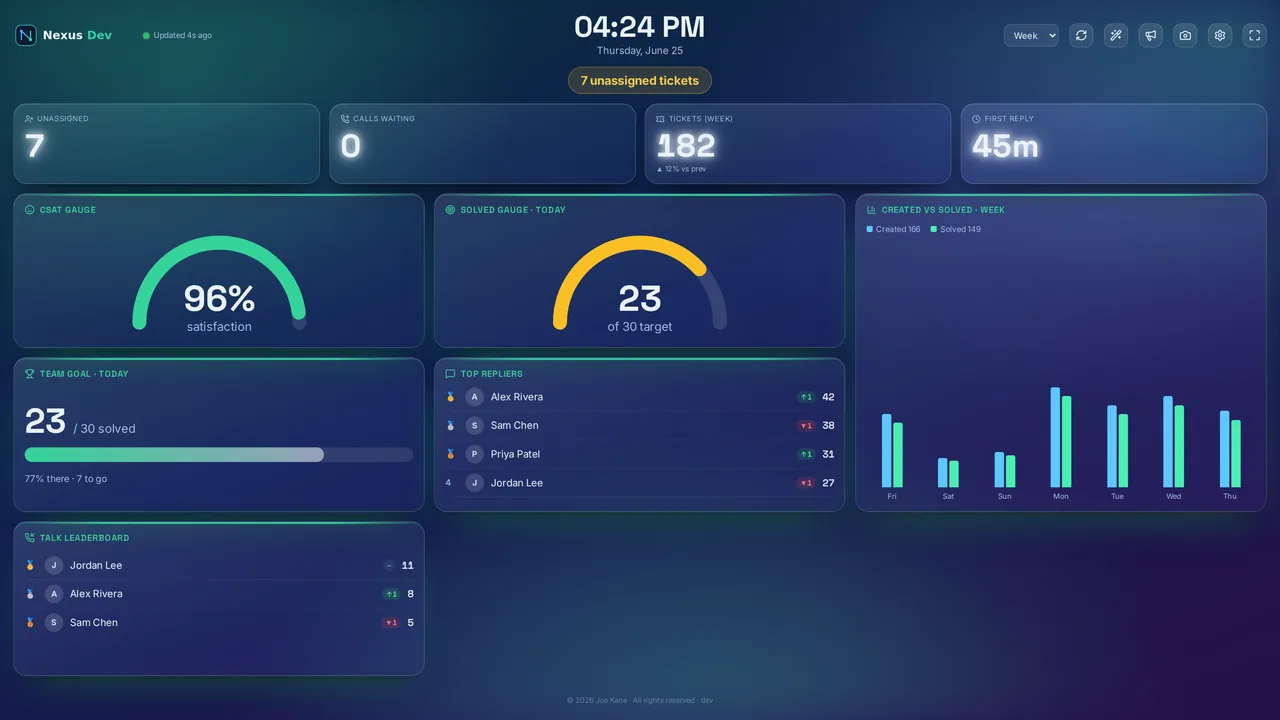
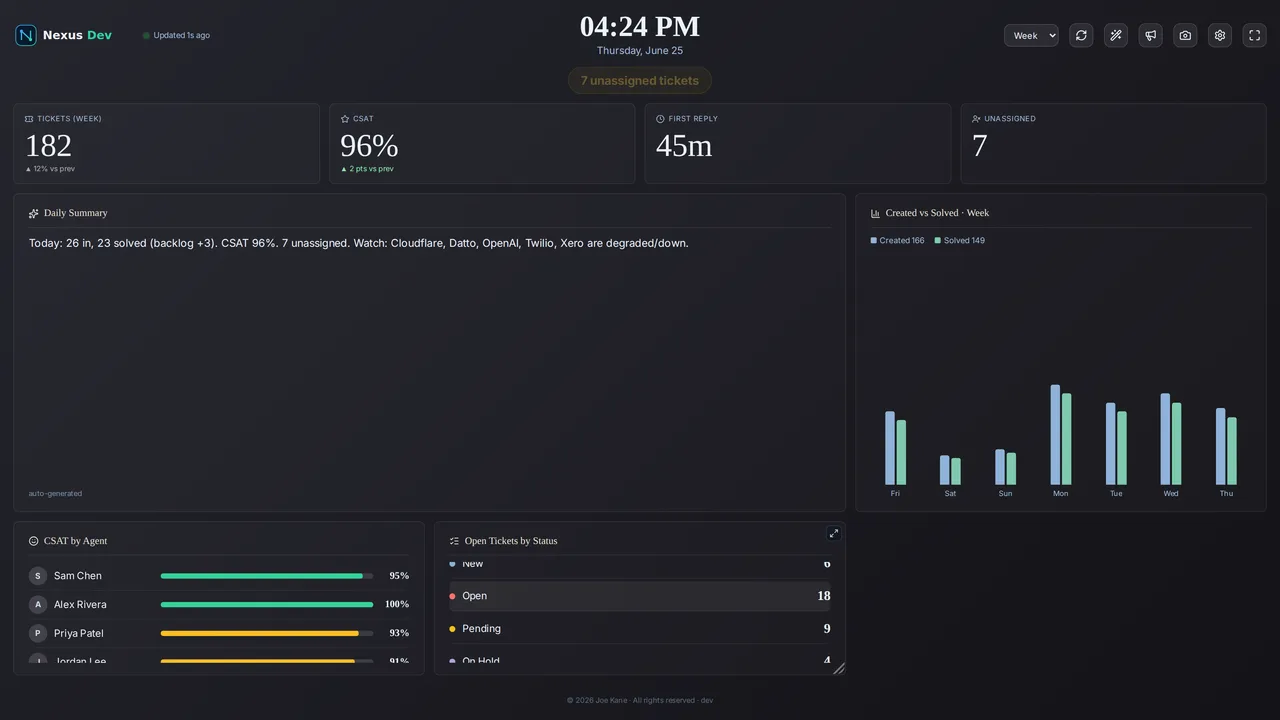
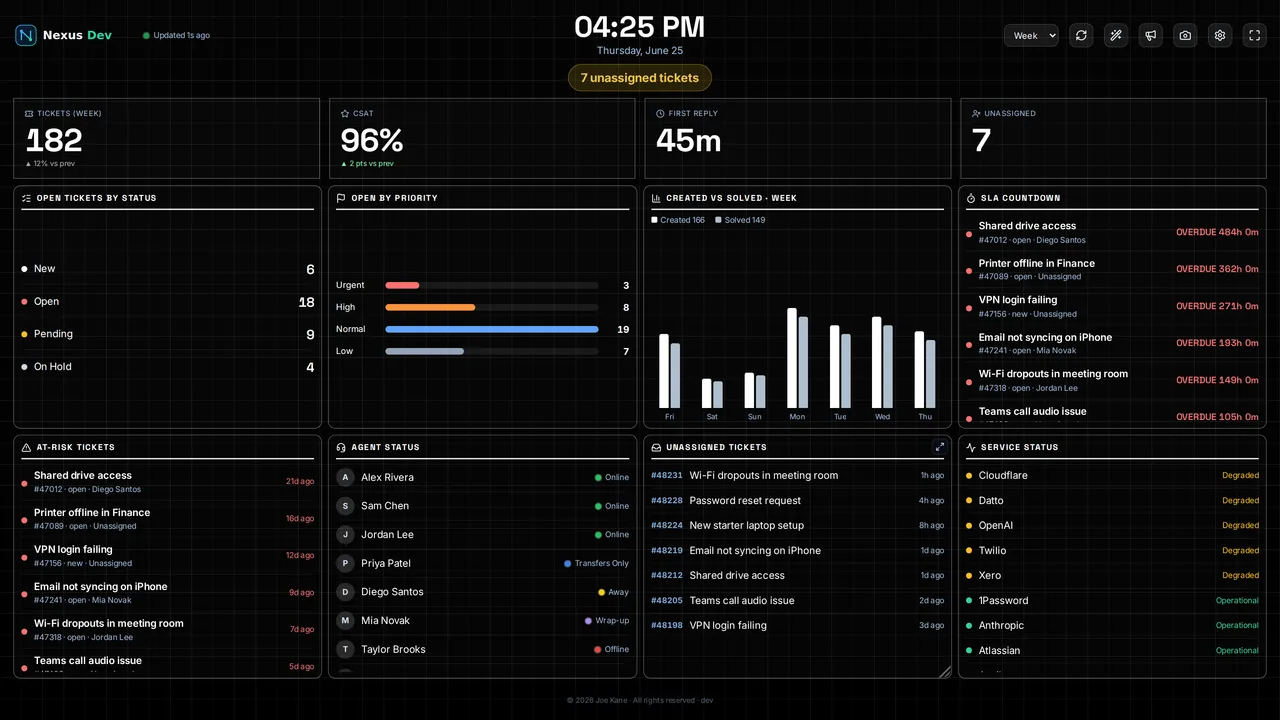
Each design loads its matched board automatically, and the same starter boards are also under Layouts → Designs — so you can mix any design with any other layout too.
Add your own logo under Settings → Logo. On the self-hosted server it's stored centrally; in the Zendesk app it's stored per-screen in the browser.
Press T (or use the menu) for TV mode: big rotating "top data" slides with smooth transitions, designed for an across-the-room wall. Combine it with the dashboard loop to cycle whole boards, and fullscreen (F) for a true kiosk display.
For a permanent wall display I drive the screen with a cheap mini-PC (a Raspberry Pi works too) running the desktop app — or a browser in kiosk/fullscreen — rather than the TV's own built-in browser. Smart-TV browsers throttle background rendering, sleep aggressively and trail behind on web features, which is the opposite of what you want on a board meant to stay live. A ~£100 box tucked behind the screen, set to launch the board fullscreen on boot, just works and survives reboots.
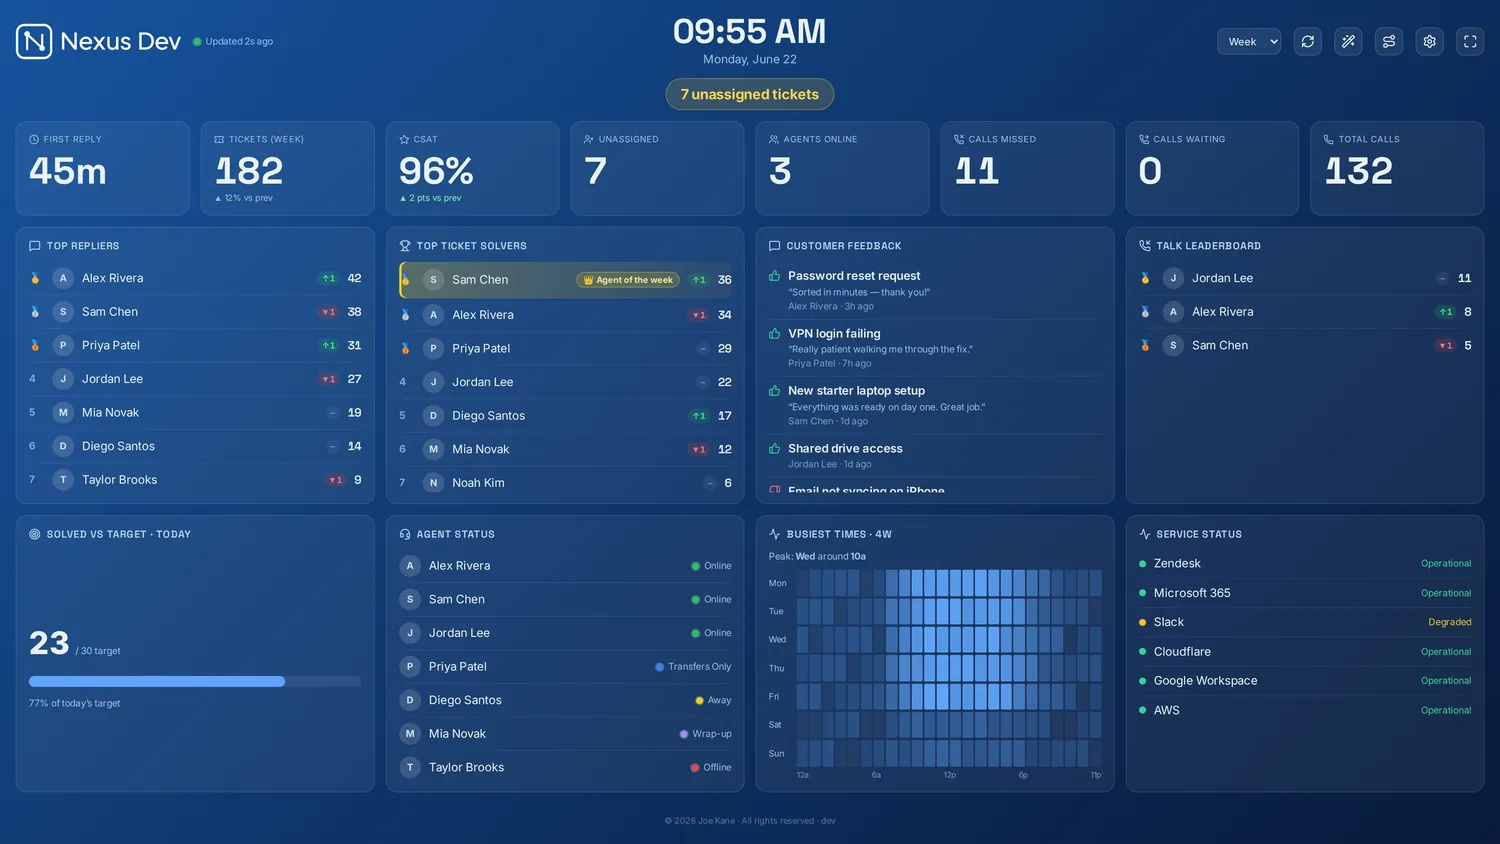
Fullscreen is available in the desktop app and the web/server deployment, but not inside the Zendesk app — Zendesk disables the Fullscreen API for app iframes. For a kiosk wall, use the desktop app or a browser.
Board styles (all plans)
A theme, look and design all restyle the same board. A board style goes one level further: it swaps the whole dashboard for a different one. Nexus ships nine — the Standard board (the fully configurable panel board this guide has been describing), the new Canvas board (a build-your-own, drag-and-drop wall), and seven ready-made dashboards, each a purpose-built screen with its own layout and graphics. Pick one under ⚙ Settings → Appearance → Dashboard and the entire wall changes in a click. It's a per-screen choice, so a reception TV can run the leaderboard while the ops desk runs a HUD.
How it fits together. Board style is the top-level choice. Pick the Standard board and everything else works as normal — panels, designs, looks and layout are all yours to arrange. Pick the Canvas board to place panels freely (see below). Pick one of the seven ready-made dashboards and you get a finished screen instead: there are no panels to arrange, but your colour theme still applies and your logo sits in the header, so it stays unmistakably yours. Every board style reads the same live data from your helpdesk as the standard one.
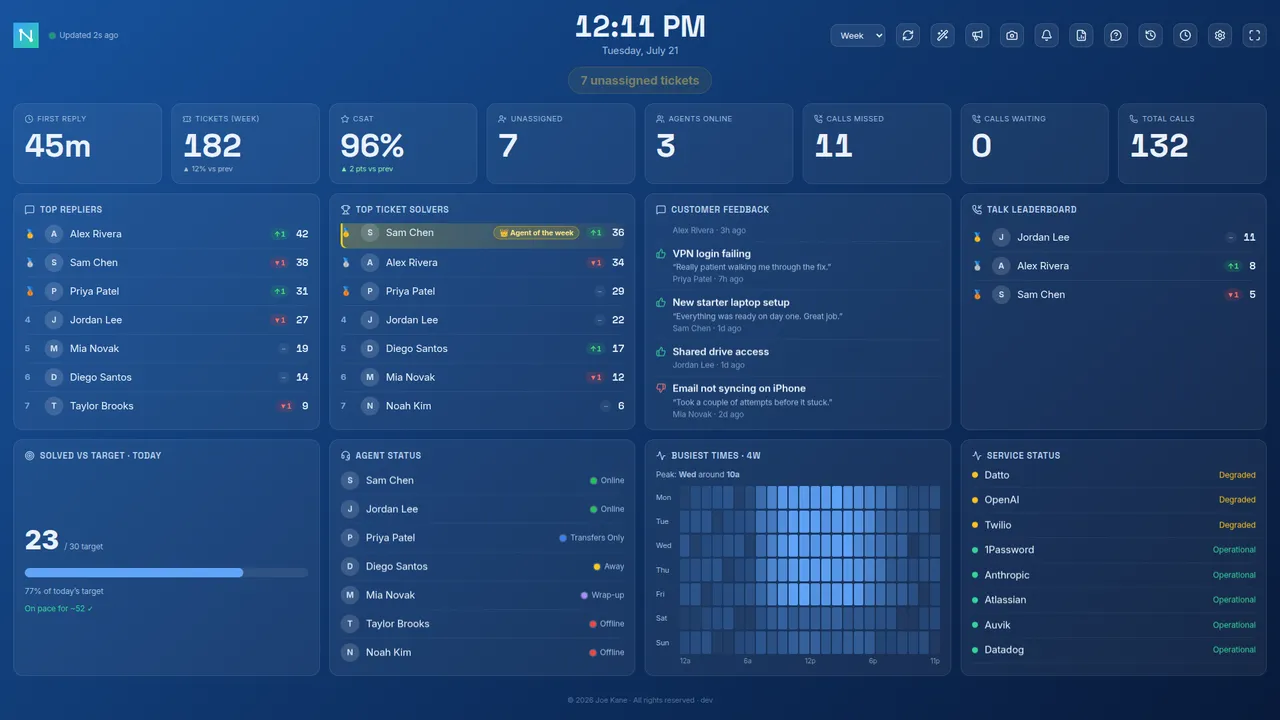
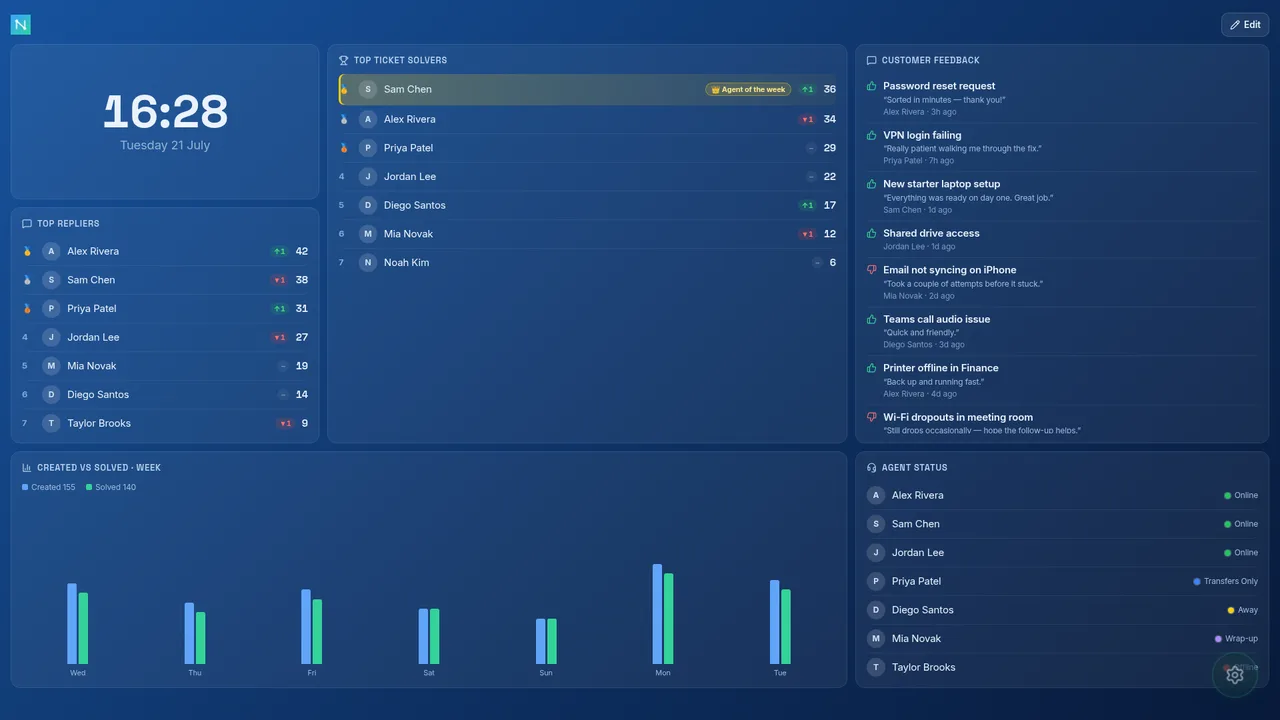
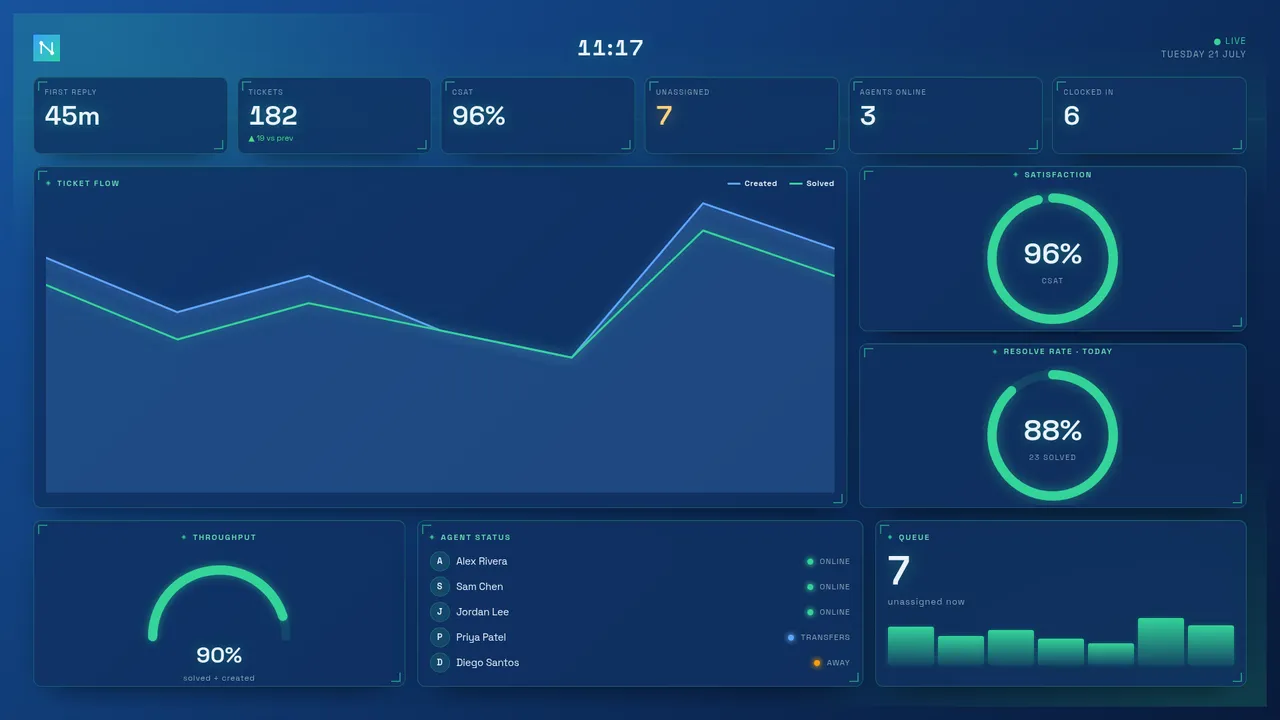
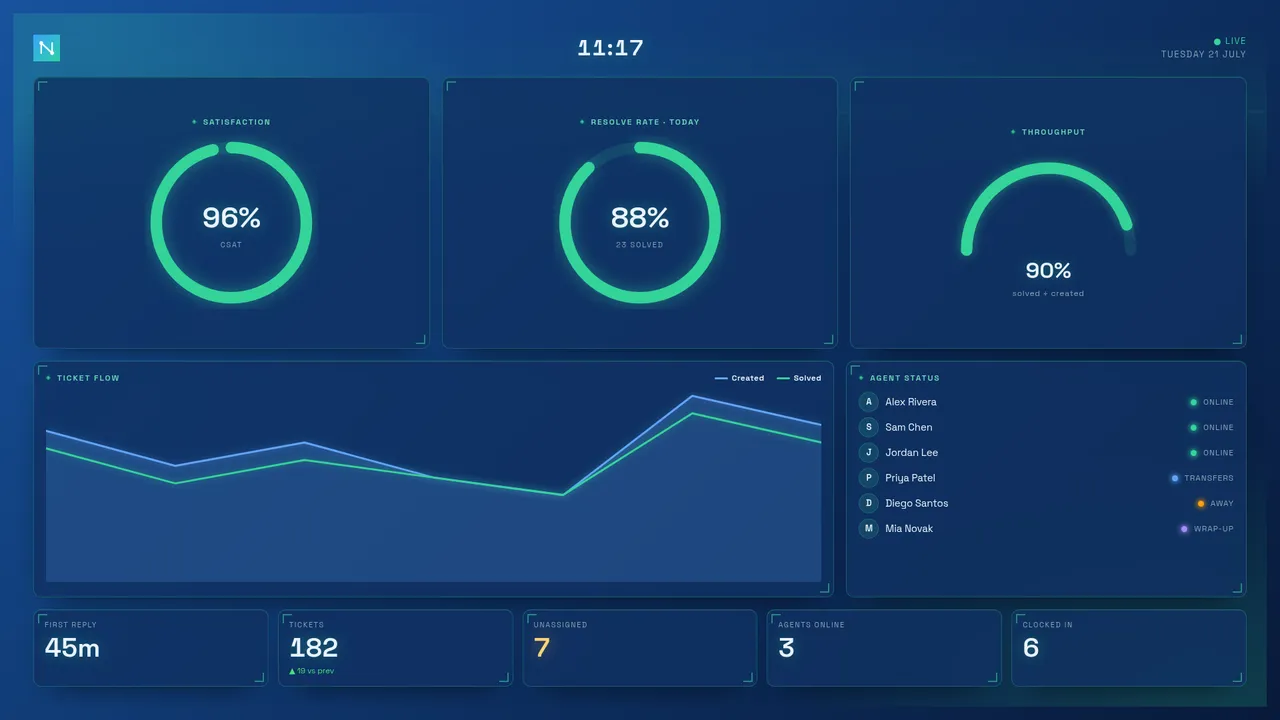
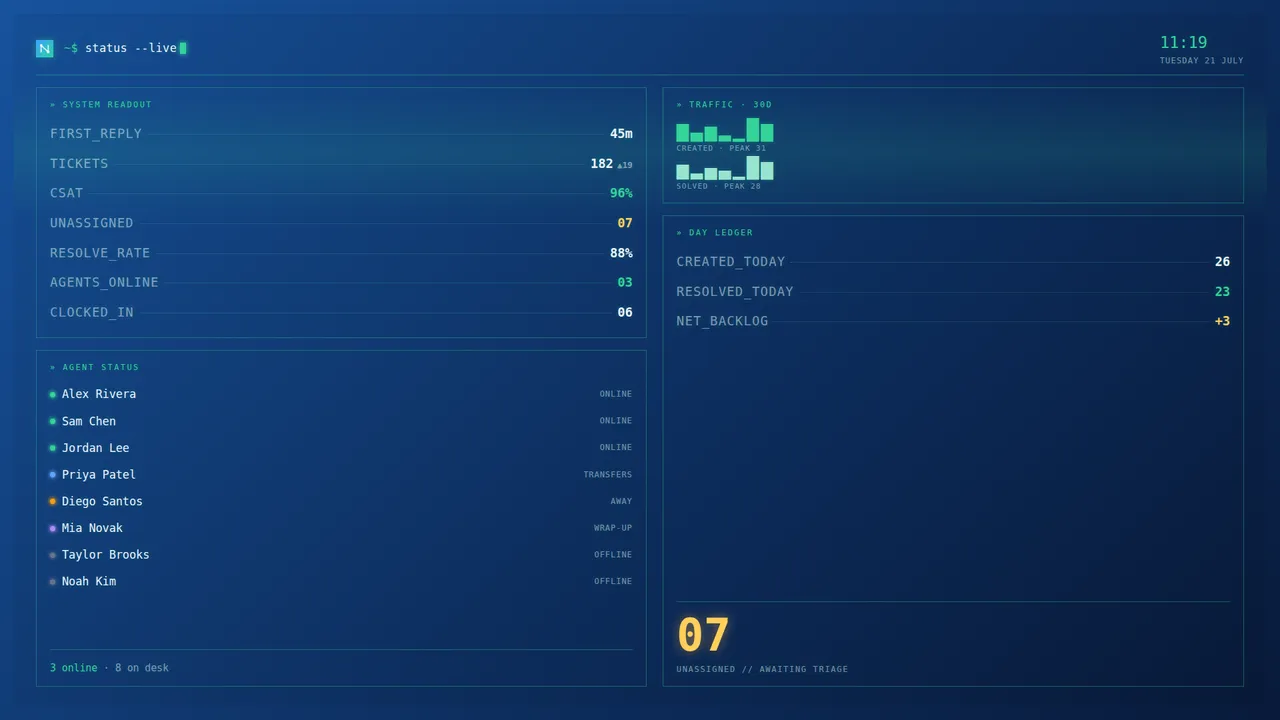
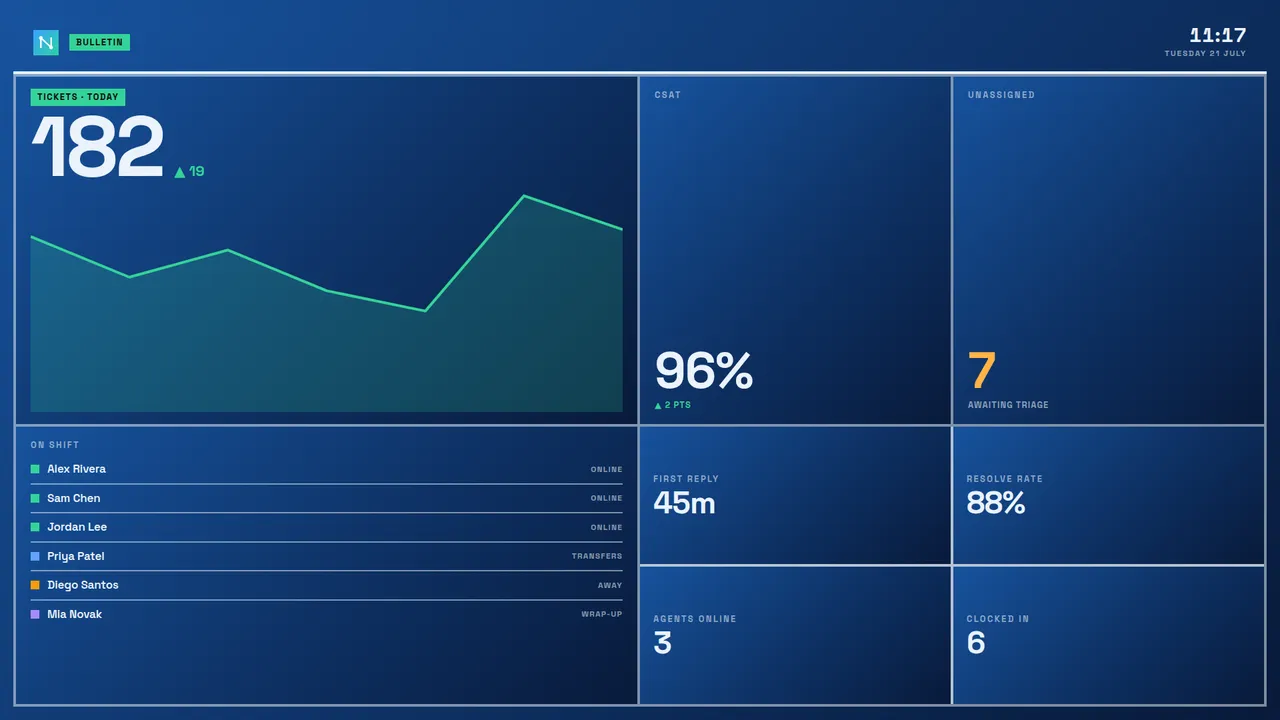
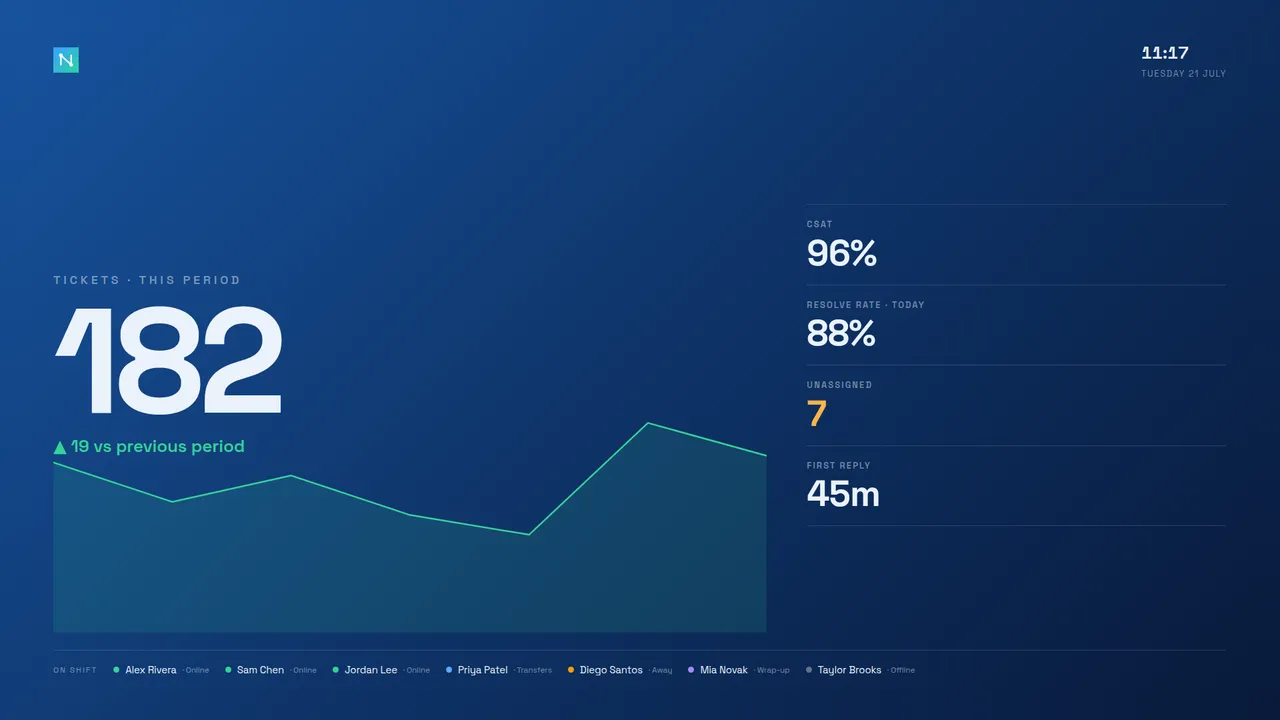
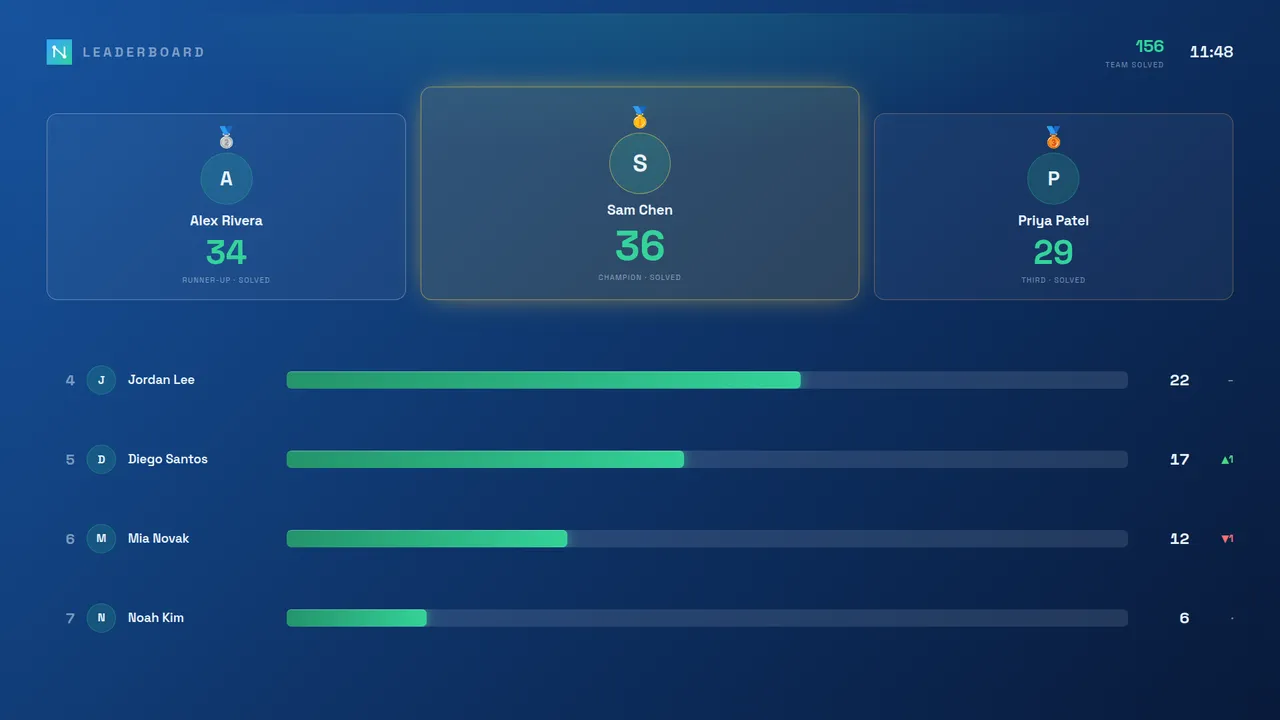
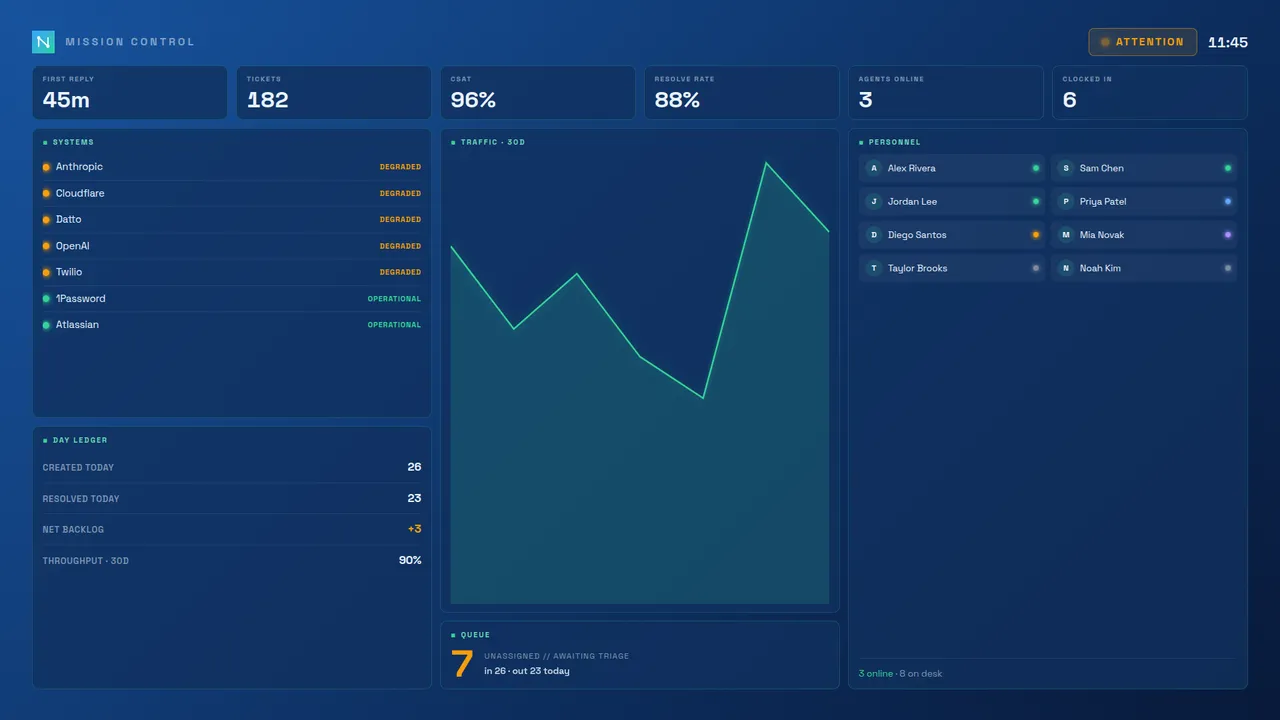
The seven ready-made dashboards, all shown on the Midnight theme. Every one recolours with your theme and carries your logo — so "a different dashboard" never means "someone else's brand".
Every style, every colour
Board styles are theme-aware, not fixed palettes. The same dashboard takes on whichever of the 11 colour themes the screen is set to — accent, chart series and background all follow — so you can match the wall to your brand or the room's lighting without giving up the design. Here is the one Flux HUD on three different themes, plus Mission Control on a fourth:
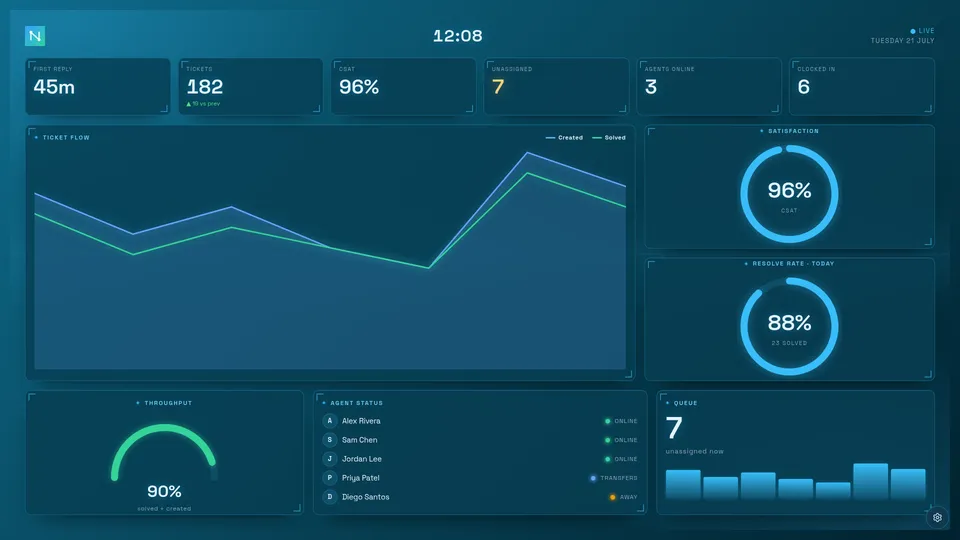
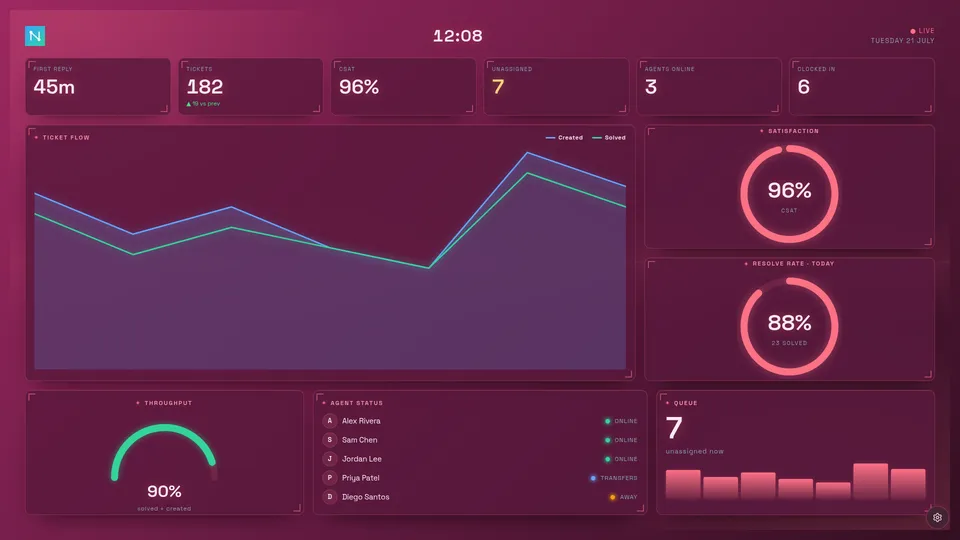
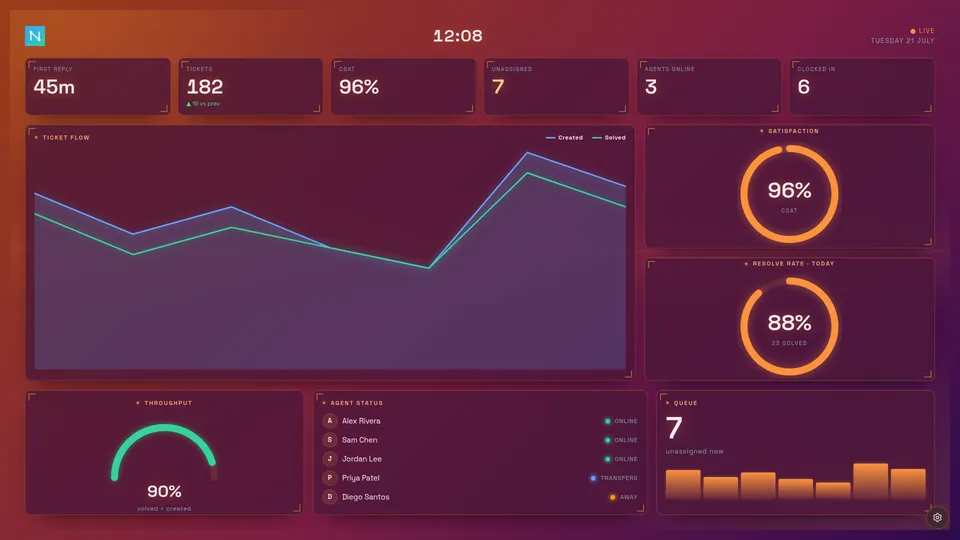
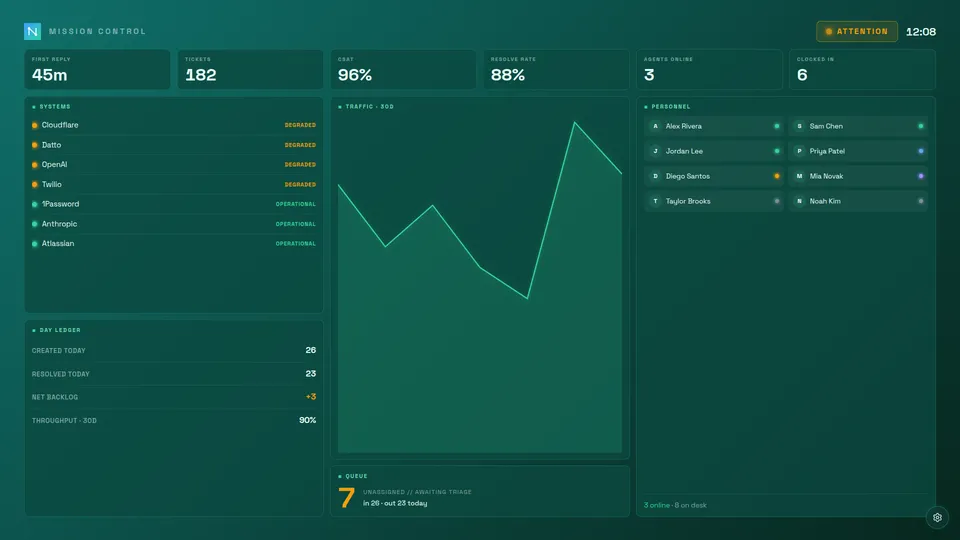
Choosing a board style
Open ⚙ Settings → Appearance and pick from the Dashboard row at the top. The choice applies to this screen and takes effect immediately — no reload. Because the ready-made dashboards render their own full screen with no top bar, they show a subtle settings gear in the corner that fades away when the wall is left alone and returns the moment you move the mouse or touch the screen — so you can always reach Settings to switch styles or themes. The keyboard shortcut S opens Settings on any board too.

Board styles are on every plan. The ready-made dashboards are fixed compositions — to rearrange panels, add your own KPIs or change the column count, use the Standard board or the Canvas board instead. All read the same live data from your helpdesk.
Build your own with Canvas
The Canvas board style is a build-your-own wall: instead of a fixed layout, you place panels anywhere on a snapping grid. It always fits one screen — the grid scales so the whole board is visible at once, never a scrollbar — which makes it ideal for an always-on wall TV. A movable clock panel is on the wall by default.
- Edit vs view. Press Edit (top-right) to arrange the wall; press Done and it locks to a clean, static board — so a public screen can't be nudged. Edit mode is per-screen.
- Add, move, resize, remove. In Edit, + Add panel opens a picker of every panel your helpdesk supports (plus the clock). Drag a panel to move it, drag its corner to resize, and use the × to remove it.
- Group panels. Drag one panel onto another to group them into a single split cell — the drop target lights up. A group's controls flip the split between side-by-side and stacked, or ungroup it again.
- Dense. The Dense toggle tightens the spacing to fit more panels on the wall.
Your Canvas arrangement is saved per dashboard, so it stays put across reloads and is shared with any other screen on the same dashboard. It's theme-aware and carries your logo like every board style.
Reading the wall: text size & fit
Two per-screen options under ⚙ Settings → Appearance → Display help the standard board read clearly from across the room:
- Text size (Small / Normal / Large) scales up all of the board's text — panel titles, big numbers and labels — while keeping the same layout, so the larger text simply fills the space the board already had. Ideal when the wall is a long way from the desk.
- Fit to screen shrinks a busy or highly-zoomed board so the whole thing stays visible at once, instead of scrolling. Off by default; turn it on for an always-on wall TV that should never scroll.
Access links (Enterprise)
Access links let you share a board without handing out credentials — a named URL signs a device in automatically, at the access level you choose, and can be locked to a single client's data.
Generate named, shareable URLs that auto-sign-in a device when opened. Each link is independent, so you can hand a wall TV its own link, give a manager another, and revoke either without touching the rest. Links can carry an optional expiry. Access links require a view passcode to be set first (in Settings → Security & access) — without a passcode the board is open to anyone and links have no effect.
- View-only — perfect for a public screen or a client-facing board; the device can watch but not drill into ticket lists or reconfigure. Client-scoped links are always view-only (the server enforces this).
- Advanced — everything view-only shows, plus drill-downs: clicking a number opens the tickets behind it. Right for an agent's desk screen; still no access to settings.
- Admin — full access; the device can change settings and manage the board.
A link can be client-scoped so the whole board is filtered to a single client organisation (your helpdesk's orgs/companies) — ideal for a client-facing screen. Scoping isn't just a UI filter — data isolation is enforced server-side, so a client-scoped link genuinely cannot see other organisations' data, even via the API. Client-scoped links also have a view-type option: Client-facing (safe to share with the client — shows only their tickets, queues and at-risk items) or Internal focus (for your team — adds replier/solver panels, still filtered to that client).
Create and manage access links
Open ⚙ Settings → Security & access (admin only, Enterprise plan). Under the Access links · share view-only or admin URLs heading, click Manage access links…. The link manager shows any existing links plus a creation form:
- Enter a New link name — a descriptive label (e.g. "Reception TV", "Client: Acme Corp"). Maximum 80 characters.
- Choose the Scope:
- Whole dashboard — the link shows the full board. Choose the role: View-only, Advanced (adds drill-downs) or Admin.
- One client — the link filters the board to a single client organisation. Select the client from the dropdown; choose Client-facing or Internal focus. Client-scoped links are always view-only.
- Choose an Expiry: Never, 7 days, 30 days or 90 days.
- Click Create link. Nexus asks one follow-up: alert you if the screen using this link goes offline? Say yes for a wall TV that should never go dark; skip it for a colleague's laptop. The choice shows as a badge in the link list and can be changed any time per screen under ⚙ Settings → Screens.
- Copy the generated URL immediately — it is shown only once. The server stores only the SHA-256 hash of the token; the plaintext token (embedded in the URL) is never recoverable afterwards.
- Send the URL to the intended recipient or paste it into the browser on the target device.
To revoke a link, click Revoke next to it in the list. The token is deleted from the server's store and stops working instantly.

The link list shows each link's name, role (or client scope), last-used time and expiry date. Expired links are shown in red and stop working automatically.
Named user accounts (Enterprise)
Instead of one shared passcode, give each person their own account with a username, password and an access level. Sign-ins are individual, so a person leaving means disabling one account rather than rotating a passcode everyone knows; and the audit trail can then name who did what. Manage accounts in ⚙ Settings → Security & access → User accounts; passwords are scrypt-hashed and never stored in the clear, with lockout protection against guessing. The setup wizard asks the same question on a fresh install — open network, shared passcode, or named accounts starting with yours — so a new board lands secured from day one.
Four access levels, each a superset of the one below — pick the smallest that does the job:
- Viewer — watches the board: look, layout and panels for their screen, nothing more. No drill-downs, no settings.
- Advanced — adds drill-downs: clicking a number opens the tickets behind it.
- Manager — adds the Reports studio (download branded PDFs) and user management: managers can create and manage viewer and advanced accounts for their team, but can't touch board configuration, the audit trail, or mint other managers and admins.
- Admin — everything, including settings, security and the audit trail.
Notifications follow the same ladder — security events reach admins only, report events managers and up.
Give each account an optional team name — type it once and it's offered as a suggestion for the next account, so a team never splinters into three spellings. The accounts list then reads like an org chart: grouped by team, managers and admins sorted to the top.

Single sign-on (Google, Microsoft & reverse proxy) (Enterprise)
Let people reach the board with the company login they already have — no separate Nexus password. Two routes, configured in ⚙ Settings → Security & access → SSO:
Sign in with Google or Microsoft. Connect a Google Workspace or Microsoft 365 app and the sign-in screen grows a "Sign in with Google/Microsoft" button. Pick the provider, paste the OAuth client ID and secret from your Google Cloud / Microsoft Entra app registration (the settings panel shows the exact callback URL to register), and — for Microsoft — your tenant. Then set the policy: restrict sign-ins to your email domain, and choose whether a first-time sign-in auto-provisions an account and at which access level (viewer by default — promote people afterwards). The secret lives in the encrypted secrets store, and the flow is the standard server-side authorisation code exchange — tokens never pass through the browser.
Directory groups pick access levels. With Google/Microsoft sign-in on, map directory group names (or IDs) to Nexus access levels under the SSO settings — the highest matching level wins, and anyone in no mapped group falls back to the default. Microsoft sends groups once your app registration adds a groups claim; Google needs the group names in a custom claim (its standard sign-in doesn't carry them). Turn on re-apply on every sign-in and a directory move changes the person's Nexus level automatically — promote someone to Team Leads in your directory and their board access follows.
Identity-aware reverse proxy. Alternatively, put Nexus behind Authelia, oauth2-proxy, Cloudflare Access and the like, and it trusts the signed-in user the proxy passes in a header — configure which header carries the username. The security boundary matters: the header is trusted only when you've declared the proxy via the TRUST_PROXY environment variable and enabled SSO and your licence grants it — so a request that didn't come through your proxy can't forge an identity.

Embeddable / public dashboards (Enterprise)
Publish a read-only board and drop it into an intranet, a status page or a wiki as an iframe. An embed access link renders the board chrome-less (no top bar or settings), and you control exactly which websites are allowed to frame it — add their origins under ⚙ Settings → Security & access → Embed origins. The server sends a matching frame-ancestors Content-Security-Policy so no other site can embed your board.

Client status card. Don't want to show a customer the whole board? Add &status=1 to an embed link's URL and it renders a compact status card instead — overall health, open and waiting queues, and today's created/solved, refreshing every minute. Combined with a client-scoped link it becomes "your live service view" for that customer's portal: their numbers only, nothing else reachable.
Audit trail (Enterprise)
For a team sharing one board, keep a record of who changed what — settings saved, screens commanded, access links created or revoked, accounts changed. ⚙ Settings → Security & access → Audit trail shows the recent activity with the action, a short non-sensitive detail and the actor (the named account, where accounts are in use). It logs the action, never the values themselves.
Export & retention. An Export CSV button downloads the whole trail as a spreadsheet-safe file (values that could execute as formulas are defused), and a retention window ages entries out on your schedule — set the number of days to keep, or 0 to keep everything the trail's size allows.
Named accounts, SSO, embeddable dashboards and the audit trail are Enterprise features — see Plans.
Screens (multi-screen control)
Run the board on several TVs, desks and phones? Screen Sync (v1.46+, Pro and Enterprise) gives the admin a live view and remote control of every connected screen — from ⚙ Settings → Screens on any admin device. Every screen quietly checks in with the server every few seconds; commands you issue are picked up on the next check-in, so changes land within seconds, work through any reverse proxy, and need no extra infrastructure.
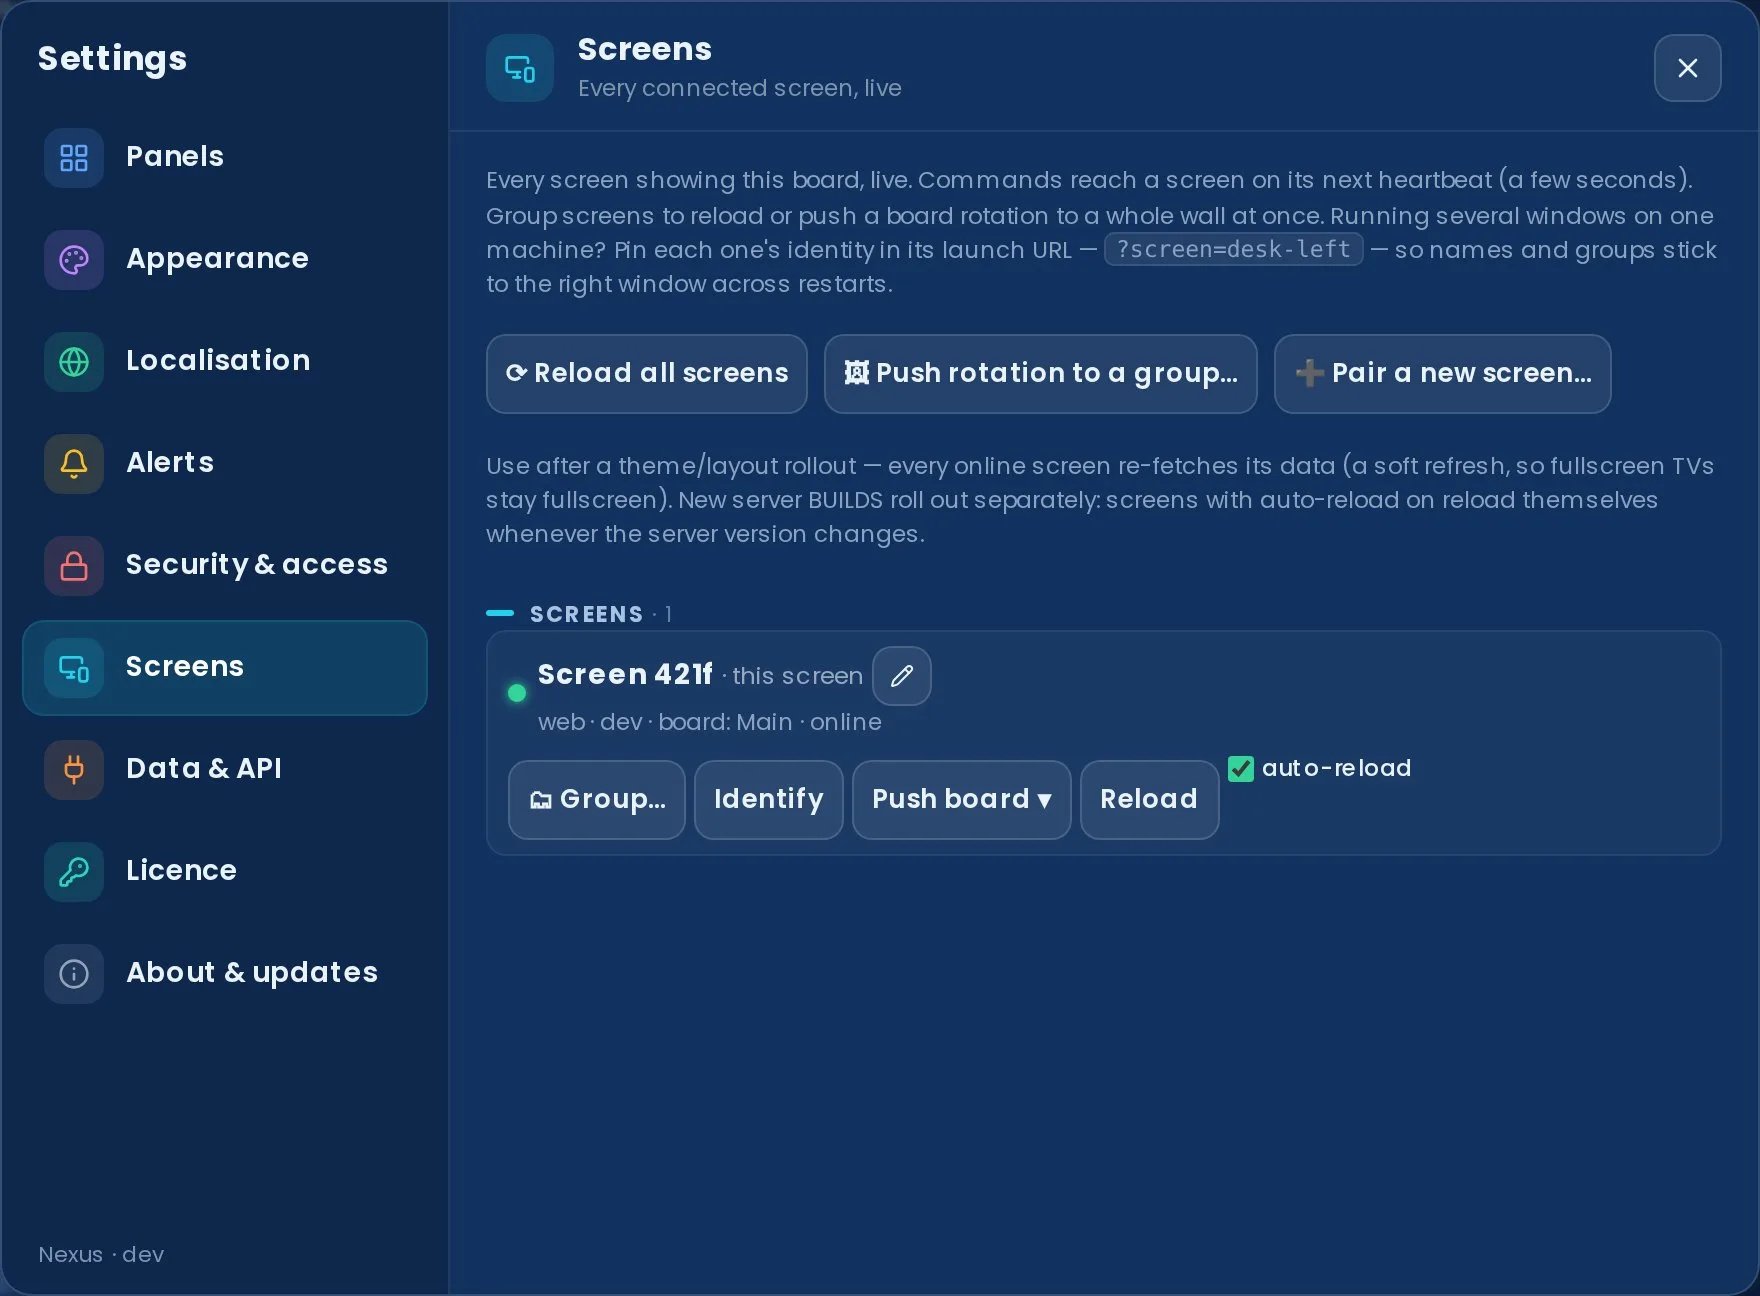
What you can do per screen:
- See it live — name, online status, platform, build version, which board it's showing, and last-seen time. Each screen self-registers the first time it loads the board.
- Identify — flashes a full-screen badge on that device for a few seconds, so you can tell which physical TV is which before renaming it ("Reception TV", "Support pod 2"…).
- Rename — give it a friendly name; survives restarts.
- Reload — that screen re-fetches the board (new build, fresh state).
- Push board — sends the layout you're currently looking at on the admin device to that screen. The screen imports it as its "pushed" dashboard and switches to it — so you can rearrange panels on your laptop, then push the result to a view-only TV without touching it. Pushing again replaces the previous push.
- Auto-reload — when on, the screen reloads itself whenever the server is updated, so a wall of TVs rolls onto a new build with no ladder required. Defaults on for view-only screens and off for admin devices (so an update never yanks you mid-edit). No internet access required on the screens — they detect the change straight from your server.
- Forget — remove a retired device from the list (it re-registers fresh if it ever connects again).
And board-wide: ⟳ Reload all screens — one click after a server update or a theme/layout rollout and every online screen re-fetches.
Wall TVs on a Raspberry Pi (kiosk guide)
Nexus is a plain web app, so a wall screen only needs a browser in kiosk mode — which makes a £35–£70 Raspberry Pi a perfectly good wall device: no PC per TV, no per-screen signage licence. Everything a screen needs rides in its launch URL — ?screen=Reception%20TV names it in Screen Sync, ?team=<id> pins its team scope, and an access-link ?key= signs it in without a keyboard — and from then on you drive it remotely from Settings → Screens (identify, rename, push a board, rotation playlists, auto-reload on update).
The short version for Pi OS: install Chromium, launch it with --kiosk pointed at your server with the params above, and disable screen blanking (xset s off; xset -dpms). The full recipe — auto-login, cursor hiding, overscan and sleep-proofing — lives in the repo's KIOSK guide. Any device with a modern browser works the same way: a Fire TV stick with a kiosk browser, an old laptop, a NUC, or a signage player that can show a URL.
Wallboards and people are listed separately. A screen signed in with named-account credentials is classed as that person's device and grouped under Users — expand a user to see every screen their credentials are signed into, with a device count and how many are online right now (handy for spotting a login left on a meeting-room PC). Everything else — passcode and access-link screens — lives under Wallboards. The split also drives offline alerts: only wallboard screens can raise one; a person closing their laptop is never an incident. Each wallboard screen has its own offline alert tick (pre-seeded by the access-link prompt, overridable here), and a screen that re-registers after a restart is recognised by its device identity and keeps its name — no duplicate "Screen 3f2a" entries piling up.

Screens behind a passcode or an access link (including client-scoped links) participate automatically once signed in. All management actions are admin-only; screens can't command each other.
Switchboard PUBLIC BETA · PRIVATE ADD-ON
Switchboard reads your unassigned queue and gets each ticket to the right person — matched by specialism, who's actually free (from your help desk's live agent presence) and current load. It classifies from the ticket's subject and body, and you choose how it acts: manual (it recommends, you click Assign) or automatic (it assigns for you, behind a dry-run and your safety rails). It can also learn each engineer's specialisms from your solved history, and optionally use your own AI provider for the tickets keywords can't call. It runs on the help desk Nexus is already connected to, so there's nothing new to plug in. See the Switchboard overview for what it does.
Public beta — included with Enterprise. Switchboard is a private add-on that stays hidden in Nexus unless your licence key carries the entitlement; there's no upsell, just nothing, until it's on your plan. It ships with every Enterprise licence — see plans or use the contact form.

Turn it on
- Once your licence includes the add-on, a Switchboard button appears in the board's top toolbar (it won't show otherwise).
- Open it and go to the Team tab. Add each engineer, tick their specialisms (the first you tick is their primary area), set a capacity cap, and flag whether they can take on-site work or should be left out of automatic routing. The name must match the agent's name in your help desk so Switchboard can read their live availability.
- Import from helpdesk seeds the roster from your help desk's live agents in one click — then refine each engineer's specialisms. Prefer to learn it instead? On the Team tab, Suggest from history reads each engineer's recently-solved tickets and proposes their specialisms (with the evidence) for you to review and apply. No AI key needed for the keyword version; AI setup (no key) instead gives you a prompt to paste into your own ChatGPT/Claude and decodes the code it returns.
- The Board tab then shows the unassigned queue, each ticket tagged by area & priority, with the recommended engineer and a full routing trace (it shows its working).
- The Routing tab sets the mode — Off, Manual or Automatic — and, for automatic, the rails: a dry run (audit-only), a per-minute cap, business-hours-only, online-only, priorities to never auto-assign, and areas to exclude. Optional AI routing asks your configured provider (Settings → AI) to pick the engineer only when the keyword classifier is unsure — its subject & body are sent to that provider then, always with the built-in engine as the fallback.


Manual or automatic. In manual mode each routed ticket gets an inline Assign button that writes the assignment straight back to the help desk; in automatic mode Switchboard writes it for you (oldest-first, under your rails), and every action — including dry-run previews — is listed under Recently auto-assigned. Write-back is available for Zendesk, Freshdesk, Freshservice and HaloPSA. Jira Service Management is advisory-only — its agent-id model can't address an assignee, so Switchboard recommends without a one-click write-back.
Write-back for these providers is built to each vendor's documented API. Switchboard ships manual by default — it recommends, you assign — and automatic mode is opt-in, behind a dry run and the safety rails.
Write-back support by help desk
Switchboard's recommendations work on every help desk Nexus connects to (they only need live agent presence + the unassigned queue). Applying a recommendation with one click — the write-back — depends on the provider:
| Help desk | Recommend | One-click assign | How it writes |
|---|---|---|---|
| Zendesk | ✅ | ✅ | assignee_id on the ticket |
| Freshdesk | ✅ | ✅ | responder_id on the ticket |
| Freshservice | ✅ | ✅ | responder_id on the ticket |
| HaloPSA | ✅ | ✅ | agent_id via the Tickets API |
| Jira Service Management | ✅ | — advisory only | id model can't address an assignee |
| SuperOps | ✅ | — advisory only | no write-back endpoint mapped yet |
| NinjaOne | ✅ | — advisory only | no write-back endpoint mapped yet |
| ConnectWise PSA | ✅ | — advisory only | no write-back endpoint mapped yet |
Troubleshooting
- An engineer shows "no presence" — their roster name doesn't match an agent in your help desk. Names are matched case-insensitively; make them identical. Without a live match an engineer is treated as offline and won't be routed to.
- No Assign button on a ticket — either your provider is advisory-only (Jira), the ticket is held (nobody eligible was free), or the recommended engineer has no live agent match to assign to.
- "Assignment couldn't be applied" — the write reached your help desk but it refused it (permissions, a closed ticket, or an agent who can't own that queue). The exact API error is surfaced; the recommendation stays so you can retry or assign manually.
- The Switchboard button isn't there at all — your licence doesn't include the add-on yet. It ships with Enterprise; see plans or get in touch.
Board settings reference
Everything configurable lives in ⚙ Settings, organised into nine sections. Anything marked this screen is stored per device — a wall TV can behave differently from your laptop — and everything else applies board-wide.

The nine settings sections
- Panels — show, size & reorder panels, the KPI strip, layout presets & multiple dashboards.
- Appearance — theme, zoom, density, display behaviour, TV mode & logo.
- Localisation — language, clock, date format & timezone, per screen — reception can run in a different language from the support pod.
- Alerts — sounds & chime style, highlight thresholds, webhooks, digests & the announcement ticker.
- Security & access — view passcode, named user accounts, access links, SSO, embed origins, the audit trail & the admin token.
- Screens — every connected screen, live (see multi-screen control above).
- Data & API — connections, custom views, diagnostics, history export & configuration backup.
- Licence and About & updates — your plan and key; your version and the right update path.
Recent additions worth knowing about
- Notification centre (the 🔔 bell in the top bar) — every alert, goal, announcement and security event pops up top-centre, files into a history, and opens a details view. See Notification centre.
- Reports studio (the report button in the top bar · Pro) — branded PDF reports on demand, for the whole desk, one team or one agent. See Reports studio.
- Team scope (Panels → Team scope) — point a screen's agent panels at one team, per screen with a board default; a top-bar chip names the scope. See Team scope.
- Sign-in, your way (Security & access → Sign-in) — one shared passcode or named accounts at four access levels, plus Google/Microsoft sign-in. See Named accounts and SSO.
- Paged scrolling (Appearance → Display) — long panels normally crawl smoothly; Paged holds still and steps a screenful at a time instead — kinder on motion-sensitive eyes. Per screen.
- Quiet hours (Appearance → Behaviour · Pro) — give a screen a nightly window where the board dims or goes dark, per screen — the wall TV sleeps overnight, your desk doesn't have to.
- Custom theme (Appearance → Theme) — pick an accent and a base colour and Nexus derives the full palette. Pair it with the Match theme logo style to tint the header logo to suit.
- Chime style (Alerts → This screen) — choose the alert sound character per screen, with a preview as you pick.
- Announce (the 📣 megaphone in the top bar) — type a message and every screen's ticker carries it within seconds; manage or clear it under Alerts → Server alerts & digests.
- Board snapshot (📸 in the top bar · Pro) — download the live board as a PNG, ready to paste into chat or a monthly report.
- History export (Data & API → Tools) — your persisted daily history (created / solved / CSAT per day) as CSV for spreadsheets.
- Pair a screen (Screens) — a QR code that joins a new TV as a named, view-only screen in one scan; revocable any time under Security & access.
- Configuration backup (Data & API → Tools) — export your whole server config (panels, themes, business hours, alerts — minus the encrypted secrets) as a file, then import it to clone the setup onto another server or roll back a change.
Plan-gated settings stay visible with a small lock and an upgrade note rather than disappearing — so you always see what the board can do. See Plans for what's included where.
Environment reference
You normally don't edit config by hand — the setup wizard collects everything and encrypts API keys into ./data. For headless or scripted deployments, copy .env.example to .env (or pass the variables directly to docker run -e / the Compose environment: block).
The full set of variables the server reads from process.env is listed below. Every variable is optional unless marked required on Linux/macOS.
Full variable reference
| Variable | Default | Description |
|---|---|---|
PORT |
3001 |
TCP port the Express server listens on. Update the Docker ports mapping to match if you change this. |
DATA_DIR |
./data |
Absolute or relative path where mutable runtime state is stored: settings.json, secrets.json, links.json, the uploaded logo and history samples. Point it outside the deploy directory so updates don't wipe config. The Docker image sets this to /data. |
NEXUS_DEMO |
unset | Set to 1 to run with built-in sample data (no helpdesk account needed). Demo mode bypasses all licence checks and unlocks every feature for exploration. |
NEXUS_LICENSE |
unset | A signed licence key (NXS1.…) supplied as an environment variable — an alternative to pasting it in Settings. Overridden by a key stored in settings.json. |
DASHBOARD_TOKEN |
unset | Optional admin token. When set, sensitive mutating routes (save settings, write secrets, upload branding) require the value via Authorization: Bearer <token> or the X-Dashboard-Token header. Read-only data routes stay open. Unset = open (original trusted-LAN behaviour). |
DASHBOARD_SECRET_PASSPHRASE |
none | Required on Linux/macOS. A long, stable random string used to derive the AES-256-GCM key for encrypting secrets at rest. Losing it makes stored API tokens unrecoverable. On Windows the server uses DPAPI instead and ignores this variable. |
DASHBOARD_SECRET_BACKEND |
auto | Force the secret-encryption backend. Accepted values: dpapi (Windows DPAPI via PowerShell) or passphrase (AES-256-GCM). Default: dpapi on Windows, passphrase everywhere else. |
ZENDESK_API_TOKEN |
unset | Plaintext Zendesk API token. Use this for quick setup; prefer ZENDESK_API_TOKEN_ENC so the token is never stored in plaintext. |
ZENDESK_API_TOKEN_ENC |
unset | Pre-encrypted Zendesk API token (produced by npm run encrypt-secret -- <token>). Preferred form for production. If both are set, the encrypted form takes precedence. |
ONCALL_ICS_URL |
unset | URL of a published .ics calendar (e.g. from Google Calendar, PagerDuty) for the On Call panel. Can also be set in the wizard or Settings. |
ANTHROPIC_API_KEY |
unset | Anthropic API key for AI-powered daily summaries. Without a key the summary panel falls back to a rule-based digest. Can also be set in the wizard or the encrypted secrets store. |
OPENAI_API_KEY |
unset | OpenAI API key — alternative to ANTHROPIC_API_KEY for AI summaries. If both are set, Anthropic is preferred. |
UNIFI_HOST |
unset | URL of a self-hosted UniFi OS console or legacy controller, e.g. https://192.168.1.1. Powers the UniFi Monitoring panel. |
UNIFI_USERNAME |
unset | Local controller account username for the UniFi panel. |
UNIFI_PASSWORD |
unset | Local controller account password. Prefer setting this via Settings (stored encrypted) over a plaintext env var. |
UNIFI_SITE |
unset | UniFi site name to report (e.g. default). Omit to report all sites. |
UNIFI_INSECURE |
true |
Set to false to reject self-signed TLS certificates on the UniFi controller. Default true (accept self-signed) because most self-hosted controllers use self-signed certs. |
NEXUS_TELEMETRY_OPTOUT |
unset | Set to 1 to disable the periodic (~every 30 min) telemetry beacon on a self-hosted install. Telemetry sends exactly { licenceId, version, plan, provider, instanceName? } — the provider field is just the helpdesk product name (e.g. zendesk), never customer data. It can also be toggled in Settings → Licence → Opt out of anonymous usage telemetry. On our managed hosting this opt-out doesn't apply and the board checks in about every five minutes, but it uses the same exact minimal envelope: no hosted flag, uptime, health details, error count or error message. |
VITE_APP_VERSION |
dev |
The version string shown in the dashboard footer and reported in telemetry. Injected automatically at build time by the Docker workflow (set to the release tag, e.g. v1.2.3). You don't normally need to set this manually. |
TRUST_PROXY |
unset | Set to 1 when Nexus runs behind a reverse proxy you control, so X-Forwarded-For / X-Forwarded-Proto are trusted for client-IP derivation (HSTS detection, READ_ALLOWLIST, rate limiting) and for reverse-proxy SSO header trust. Without it those forwarded headers — and the SSO identity header — are ignored, so a request that bypasses the proxy can't forge a user or an IP. Enterprise (required for SSO). |
WEB_DIST |
apps/web/dist |
Path where the server looks for the built web app in production mode. Override only if you have a non-standard build layout. |
.env is gitignored — never commit real credentials. Prefer the wizard or the _ENC encrypted forms so secrets aren't stored in plaintext. The wizard and Settings UI always win over env vars for the same setting.
Server config vs per-device state:
- Server config — provider, default theme, branding, business hours, alerts, digest. One source of truth, set by an admin; lives in
./data/settings.json. - Per-device state — dashboards & layouts, theme, zoom, density, lock, scroll speed, sound, TV mode. Stored in the browser on each device, so each screen keeps its own arrangement independently.
Security
Nexus is built to be production-minded, but a couple of things are your call — chiefly who can reach the board.
Secrets at rest — API keys and tokens are encrypted, with the backend auto-selected per OS:
- Windows → DPAPI — bound to the current user + machine; a copied file is useless elsewhere, no passphrase needed.
- macOS / Linux → AES-256-GCM with a key derived from
DASHBOARD_SECRET_PASSPHRASE(portable across machines that share it).
Encrypted values are prefix-tagged (dpapi: / aesgcm:). To produce an encrypted value from the CLI: npm run encrypt-secret -- <value>.
Read access is unauthenticated by default. Nexus shows internal stats to anyone who can reach its URL. That's intentional — a wall TV shouldn't need a login. The trade-off: don't expose it directly to the internet. Run it on your LAN, or behind a VPN / SSO / access-controlled reverse proxy. You can also set a passcode under Settings → Security — on a brand-new install, setting the first passcode asks for the one-time setup code printed in the server's startup log (see Upgrading to v1.44). Enterprise plans add access links with view-only and client-scoped sharing.

Set DASHBOARD_TOKEN to require a token for sensitive mutations — saving settings/API keys, branding. It does not gate read-only data; unset = open.
Outbound fetches are SSRF-guarded — where Nexus reaches out (status pages, on-call calendar, UniFi, AI summaries, alert webhooks), those requests are guarded so a crafted URL can't probe your internal network.
Hardening checklist:
- Firewall: on a server, allow only 22/80/443.
- HTTPS: terminate TLS at a reverse proxy (Caddy auto-issues Let's Encrypt certs; nginx via certbot).
- Access control: LAN, VPN or SSO for anything sensitive; a passcode and/or
DASHBOARD_TOKENfor config. - Back up the data path (
/datavolume orDATA_DIR) — it holds encrypted secrets, layout and history. - Rotate the Zendesk API token periodically; a dedicated service-agent account makes that painless.
Server-side encryption
This is exactly how Nexus protects your credentials on the server, end to end. Every secret — your helpdesk API token (Zendesk, Freshdesk, Freshservice, Jira SM, HaloPSA, SuperOps, NinjaOne, ConnectWise, Zoho Desk, Help Scout or Front), the alert webhook URL, your monitoring credentials (UniFi, Meraki, Aruba, Omada, SuperOps, NinjaOne, N-able, Datto RMM, Kaseya VSA, ConnectWise Automate, Auvik, Domotz, Acronis, Huntress and Liongard), and any LLM API key — is encrypted before it is written to disk. Non-secret configuration (subdomain, email, layout) stays in settings.json; secrets are stored separately in secrets.json on the /data volume, so the two never share a file.
dpapi: tag. The GCM auth tag is checked on every decrypt, so a tampered or truncated blob is rejected outright. (The diagram uses your selected theme's colours.)The server calls encryptSecret() on save and picks the backend automatically per OS (override with DASHBOARD_SECRET_BACKEND):
- macOS / Linux → AES-256-GCM. For each value the server generates a fresh random 16-byte salt and 12-byte IV, derives a 256-bit key from
DASHBOARD_SECRET_PASSPHRASEusing scrypt, and encrypts with AES-256-GCM. The result is stored asaesgcm:followed by base64 ofsalt | iv | tag | ciphertext. Because salt and IV are random per value, encrypting the same token twice yields two unrelated blobs. - Windows → DPAPI. The value is encrypted via PowerShell's
ConvertFrom-SecureString(the Windows Data Protection API), bound to the current Windows user + machine. No passphrase is needed, and a copiedsecrets.jsoncan't be decrypted by a different user or on a different machine. Stored with adpapi:tag.
Authenticated, not just encrypted. On macOS/Linux the GCM authentication tag is checked on every decrypt — a tampered, corrupted or truncated blob is rejected outright rather than returning garbage. Every stored value is prefix-tagged (aesgcm: / dpapi:), so the server always knows which scheme produced it; an untagged blob is treated as a legacy raw DPAPI value for backward compatibility.
The API never reveals secrets. The settings API exposes only a boolean — is this secret set? — and never returns the decrypted value, not even masked. Secrets are decrypted only in-process, at the moment they're used to call your helpdesk, a webhook, your network controller or an LLM.
There is no recovery path — by design. If you lose DASHBOARD_SECRET_PASSPHRASE (Linux/macOS), or move a dpapi: blob to a different Windows user or machine, the encrypted secrets become permanently unrecoverable — you simply re-enter them in the wizard. Keep the passphrase backed up alongside the /data volume. To pre-encrypt a value from the CLI: npm run encrypt-secret -- <value>.
Deploy
Docker
Nexus ships as a single container that serves the dashboard and its /api. The image bundles Node 26 + a modern glibc, so it runs even on hosts whose own OS is too old for Node 18+. State — settings, encrypted secrets, layout, the uploaded logo — lives in /data in the container. Mount a host volume there and back it up.
Docker Compose (simplest):
# Copy .env.example to .env and set DASHBOARD_SECRET_PASSPHRASE
docker compose up -d  # pull the published image + start in the background
docker compose logs -f        # follow logs
Served on http://localhost:3001; state persists in ./data.
DASHBOARD_SECRET_PASSPHRASE is required on Linux — the container can't use Windows DPAPI, so secret encryption falls back to passphrase-based AES. Use a long, stable value and keep it safe: losing it makes stored API tokens unrecoverable.
Prebuilt image from GHCR (no local build) — every release tag and main is published:
docker pull ghcr.io/nexus-joe-kane/nexus:latest   # rolling
docker pull ghcr.io/nexus-joe-kane/nexus:1.64.0    # pinned to a release
docker run -d --name nexus \
  -p 3001:3001 \
  -v /srv/nexus-data:/data \
  -e DASHBOARD_SECRET_PASSPHRASE="a long random string" \
  --restart unless-stopped \
  ghcr.io/nexus-joe-kane/nexus:latest
Portainer stack: if your host already runs Portainer, add a stack from the web editor:
services:
  nexus:
    image: ghcr.io/nexus-joe-kane/nexus:latest
    ports:
      - "3002:3001"
    restart: unless-stopped
    volumes:
      - nexus-data:/data
    environment:
      - DASHBOARD_SECRET_PASSPHRASE=change-me-to-a-long-random-string
volumes:
  nexus-data:
Then reverse-proxy your domain to the container port. Health check: curl http://localhost:3001/api/health should return {"status":"ok"}.
Notes:
- Port conflict on start (
address already in use) — pick a different left-hand port (e.g.3002:3001). - Settings reset after an update — use a named volume or a fixed host path, not an anonymous volume.
- Which version is running? The dashboard footer shows the image tag.
Upgrading to v1.44 or later
Two security hardenings in v1.44.0 need a one-time heads-up when you upgrade or do a fresh install:
- The container now runs as a non-root user (uid 1000, the image's
nodeuser) instead of root. Any/datathat a pre-v1.44 (root) container created — a bind mount or an existing named volume — keeps its old root ownership, so the upgraded container can't write to it until you fix ownership once. (Only a brand-new, empty volume picks up the right owner automatically.) The simplest fix works for both volume types — run it from the host (Docker as root chowns the mounted files in place):Use your container's name or id in place ofdocker exec -u 0 nexus chown -R node:node /data # -u 0 = run as root, even though the container's default user is now `node` docker restart nexusnexus(Compose:docker compose exec -u 0 nexus chown -R node:node /data). Verify withdocker exec nexus ls -la /data— it should readnode node, notroot root.Symptom if you skip this: the board loads but saving settings fails, and the logs showDon't run
chownfrom inside the container (e.g. afterdocker exec -it … sh) — you'll be the unprivilegednodeuser there and every line returnsOperation not permitted(andsudoisn't in the image). The-u 0above is what makes it run as root.EACCES: permission deniedon/data. - Fresh installs print a one-time setup code. On a brand-new install (no passcode, no
DASHBOARD_TOKEN), the server printsSetup code: xxxxxxxxto its console at startup — find it withdocker compose logs nexusordocker logs nexus. Setting the first passcode (Settings → Security) asks for this code, proving you control the host and not just the URL — it closes the window where the first visitor to a fresh board could set the passcode and lock everyone else out. Once a passcode exists the code is never needed again; existing installs that already have a passcode or token are unaffected.
Make it reachable from the apps (public URL)
The Docker quickstart serves the board on http://localhost:3001 — fine for a browser on the same machine, and a LAN IP like http://192.168.1.10:3001 reaches other devices on the same network. But the desktop and mobile apps (and anyone off-site) need a public URL over HTTPS: each client asks for your Nexus server URL on first launch and calls its /api from wherever it runs. iOS in particular requires https:// for any non-localhost server. The job, then, is: put the container behind a reverse proxy on a real domain with a TLS certificate, and hand that https://dash.yourdomain.com to the apps.
The path is the same whichever host you're on:
- DNS — add an A record (e.g.
dash) pointing at your server's public IP. - Run the container publishing its port on the host (e.g.
3001, or127.0.0.1:3001if your panel terminates TLS). - Reverse-proxy the domain → the container port, and install a Let's Encrypt certificate so the board is served over
https://. Pick your route below: a managed panel like Plesk (which writes the proxy + cert for you), a Portainer stack, or a plain VPS with Caddy/nginx. - Point the apps at it — open the desktop or mobile app, enter
https://dash.yourdomain.comon the first-run server screen, and connect.
Going public means the internet can reach the board — secure it. Read access is unauthenticated by default (a wall TV shouldn't need a login), so a bare public URL exposes your support metrics, agent names and ticket counts to anyone who finds it. Before you share the URL: set a passcode (Settings → Security), set DASHBOARD_TOKEN to gate config changes, and ideally restrict access at the proxy (IP allowlist, VPN/SSO, or HTTP auth). See Security.
My rule: the board only gets a public URL once it's behind something — a VPN, an SSO / identity-aware proxy, or at least an IP allowlist on the reverse proxy. It's read-open by design, so "public URL" really does mean "your support metrics, agent names and ticket counts are world-readable". If you genuinely need it reachable from anywhere, set a view passcode and a DASHBOARD_TOKEN — but I'd still keep a proxy allowlist in front of it. When in doubt, leave it on the LAN and reach it over the VPN.
Portainer (Docker UI)
If you manage containers from Portainer (it ships with the Plesk Docker extension, and many self-hosters run it standalone), deploy Nexus as a stack and expose it through your existing reverse proxy.
- Registries — the published image is public, so no registry credentials are needed; Portainer can pull
ghcr.io/nexus-joe-kane/nexus:lateststraight away. - Stacks → Add stack → Web editor, paste the compose below, and Deploy:
services:
  nexus:
    image: ghcr.io/nexus-joe-kane/nexus:latest
    # Publish on 127.0.0.1 so only the host's reverse proxy can reach it;
    # use 3002 if 3001 is already taken on this box. Keep the right side 3001.
    ports:
      - "127.0.0.1:3001:3001"
    restart: unless-stopped
    volumes:
      - nexus-data:/data
    environment:
      - DASHBOARD_SECRET_PASSPHRASE=change-me-to-a-long-random-string
      # - DASHBOARD_TOKEN=optional-admin-token   # gate config changes

volumes:
  nexus-data:
- Check health on the host:
curl http://127.0.0.1:3001/api/health→{"status":"ok"}. - Reverse-proxy your domain to that port and add a Let's Encrypt cert. On Plesk this is the Docker Proxy Rules step (see Plesk); if Plesk's nginx fights you over
locationblocks, add Apache directives to the domain instead:On a plain host, point Caddy/nginx atProxyPreserveHost On ProxyPass / http://127.0.0.1:3001/ ProxyPassReverse / http://127.0.0.1:3001/
127.0.0.1:3001exactly as in the VPS section. - Open
https://dash.yourdomain.com— the setup wizard runs, and the desktop/mobile apps can now use that URL.
Updating is the reason I run it here (see the personal recommendation up top): re-pull the image and Recreate with “Pull latest image” on (or Pull and redeploy on a Stack) — the named nexus-data volume carries your config across. Recreate keeps the previous container's environment variables, which is exactly what you want, and because the version is baked into the build, Settings → About & updates reports the new number correctly straight after the pull.
VPS / reverse proxy
Host Nexus on any Linux VPS — Hetzner, Linode, Vultr, AWS Lightsail, a bare VM — with automatic HTTPS via a reverse proxy.
Prerequisites: a Linux server with a public IP and ports 80/443 open; a domain with an A record pointing at the server; Docker + the Compose plugin (curl -fsSL https://get.docker.com | sh).
Caddy (auto-HTTPS, recommended): Caddy fetches and renews Let's Encrypt certificates for you. Create two files in /opt/nexus:
# compose.yaml
services:
  nexus:
    image: ghcr.io/nexus-joe-kane/nexus:latest
    restart: unless-stopped
    environment:
      DASHBOARD_SECRET_PASSPHRASE: "change-me-long-random"
    volumes:
      - ./data:/data

  caddy:
    image: caddy:2
    restart: unless-stopped
    ports: ["80:80", "443:443"]
    volumes:
      - ./Caddyfile:/etc/caddy/Caddyfile
      - caddy_data:/data
      - caddy_config:/config

volumes:
  caddy_data:
  caddy_config:
# Caddyfile
dash.yourdomain.com {
    reverse_proxy nexus:3001
}
Then: docker compose up -d. Open https://dash.yourdomain.com → the setup wizard runs.
nginx instead of Caddy: expose Nexus on localhost (ports: ["127.0.0.1:3001:3001"]), drop the Caddy service, and add an nginx server block:
# http {} scope — upgrade only real websocket requests, so normal API
# calls keep upstream keep-alive.
map $http_upgrade $connection_upgrade {
    default "";
    websocket  upgrade;
}

location / {
    proxy_pass         http://127.0.0.1:3001;
    proxy_set_header   Host $host;
    proxy_set_header   X-Forwarded-For $remote_addr;
    proxy_set_header   X-Forwarded-Proto $scheme;
    proxy_http_version 1.1;
    proxy_set_header   Upgrade $http_upgrade;
    proxy_set_header   Connection $connection_upgrade;
}
Then trust the proxy: set TRUST_PROXY=1 on the Nexus container so it honours the X-Forwarded-For / X-Forwarded-Proto headers above (client-IP derivation, the IP allowlist, rate limiting and reverse-proxy SSO). Only enable it when a proxy you control sets those headers.
Get a cert with certbot --nginx -d dash.yourdomain.com.
Operations checklist: firewall to 22/80/443 only; back up ./data; restart: unless-stopped; set a passcode and/or keep the board behind a VPN/SSO; logs via docker compose logs -f nexus.
DigitalOcean
The easiest way to host Nexus on DigitalOcean is a small Droplet running Docker, behind Caddy for automatic HTTPS. You'll have a board live at https://dash.yourdomain.com in about 15 minutes.
1. Create the Droplet: Create → Droplets; choose the Docker Marketplace image (or a plain Ubuntu 22.04/24.04 and curl -fsSL https://get.docker.com | sh); the smallest Basic / Regular plan (1 vCPU, 1 GB) is plenty; add your SSH key and note the public IP.
2. Point your domain: add an A record — dash → the Droplet's IP. Wait for it to resolve (ping dash.yourdomain.com).
3. Run Nexus + Caddy: SSH into the Droplet and create /opt/nexus with the same Compose + Caddyfile shown in the VPS section.
docker compose up -d
docker compose logs -f nexus     # watch first-run
4. First run: open https://dash.yourdomain.com — the setup wizard connects your helpdesk and encrypts your token into ./data.
5. Hardening: firewall to 22/80/443 (DigitalOcean Cloud Firewall or ufw); back up ./data (a DO Volume or periodic snapshot); set a passcode under Settings → Security.
Alternative — App Platform: Apps → Create App → Container Image, point at ghcr.io/nexus-joe-kane/nexus; set HTTP port to 3001 and add env vars; add a persistent volume mounted at /data (App Platform's ephemeral filesystem won't keep settings); attach your domain. The Droplet + Caddy route is cheaper and gives you a real persistent disk, so it's the recommended option.
Plesk
Nexus is a Node.js app that serves the dashboard and its /api. There are two ways to run it on Plesk:
- Option A — Docker (recommended, works on any OS). The image bundles Node 26 + a modern glibc, so it runs even on older hosts (CentOS/CloudLinux 7). Plesk just pulls and runs it.
- Option B — Plesk Node.js toolkit. Native, no Docker, but requires the host to support Node 20 (glibc ≥ 2.28 — AlmaLinux/RHEL 8+, Ubuntu 18.10+, Debian 10+). If the Node.js page only offers Node ≤ 17, or installing errors with
GLIBC_2.x not found, use Option A.
Option A — Docker via GHCR:
- No registry setup needed — the published image
ghcr.io/nexus-joe-kane/nexus:latestis public, so Plesk's Docker extension can pull it directly. - Left menu → Docker → add image
ghcr.io/nexus-joe-kane/nexus:latest→ Run. - Container settings: automatic port mapping off, map container port 3001 to a host port; volume mapping a host path to
/data; env varsDASHBOARD_SECRET_PASSPHRASE= a long random string, optionallyDASHBOARD_TOKEN; restart policyunless-stopped. - Start the container; confirm
http://<host>:3001/api/health→{"status":"ok"}. - Docker extension → Proxy Rules → add a rule mapping the domain → container port 3001. Plesk writes the nginx config.
- SSL/TLS Certificates → install a free Let's Encrypt cert and enable redirect-to-HTTPS.
Option B — Node.js toolkit (Node 20 hosts only): this one builds Nexus from source, and the source isn't on the public Releases page (the repositories are private) — so request a source bundle first via the contact form. Most people should use Option A (Docker), which needs nothing but the public image.
Under Domains → your domain → Node.js, configure: Node.js version 20.x; Application Mode production; Application Root = the folder the repo deployed to; Document Root = an empty public/ subfolder; Application Startup File = scripts/plesk.cjs.
Environment variables: DATA_DIR = an absolute path outside the repo folder (create it and make it writable); DASHBOARD_SECRET_PASSPHRASE = a long random string. Leave PORT and NODE_ENV unset.
Build over SSH in the application root:
npm install --include=dev
npm run build
Restart the app (Node.js panel → Restart App), open the domain for the setup wizard, and check /api/health.
Troubleshooting Plesk-specific issues:
GLIBC_2.28 not found— OS is too old for Node 18+. Use Option A (Docker).nodenv: command not foundin Git deployment actions — install/build over SSH or use Docker.- Blank page / 503 — make sure the build ran and the app/container restarted.
- Settings reset after an update — point
DATA_DIR/ the/datavolume outside the deploy directory.
Updating
Updating is non-destructive: your /data volume — settings, encrypted secrets, layout and history — and your environment variables carry over every time.
Nexus tells you when a newer release exists — ⚙ Settings → About & updates checks the release feed when you open it (and on the Check for updates button), and the dashboard footer always shows the running build. The update itself is a pull-and-recreate on your host: pick your setup below.
:latest, not :main, so the version reads cleanly.)Getting the new build onto every screen: screens with auto-reload on (the default for view-only screens) detect the new server version within seconds and reload themselves — no internet access needed on the screens. For the rest, ⚙ Settings → Screens → Reload all screens does it in one click.
Updates are open — your licence gates features, not updates, so the update path keeps working even if a subscription lapses. See Billing.
Docker Compose (the quickstart, VPS and DigitalOcean installs):
cd /opt/nexus
docker compose pull nexus && docker compose up -d
Bare docker run: docker pull ghcr.io/nexus-joe-kane/nexus:latest, then stop and remove the container and re-run it with the same -v …:/data and env vars. To stay on a known build, pin a version tag (…:1.64.0) instead of :latest.
Portainer: Stacks → your Nexus stack → Update the stack with Re-pull image and redeploy ticked (or Containers → select the container → Recreate with Re-pull image). The named nexus-data volume keeps your config.
Plesk — Docker extension (Option A): Docker → the ghcr.io/nexus-joe-kane/nexus image → Pull the latest, then Recreate the container. Plesk carries the port mapping, /data volume and env vars over; your proxy rule keeps pointing at the same port.
Plesk — Node.js toolkit (Option B): deploy/pull the new code into the application root, then over SSH re-run npm install --include=dev && npm run build, and Restart App in the Node.js panel.
Desktop, mobile & Zendesk clients: the desktop app checks at launch and downloads updates in the background — restart it to apply; iOS updates arrive through the App Store; on Android install the latest APK from the downloads page over the top; the Zendesk app updates when the latest package is re-installed. Clients are stateless renderers — all data lives on the server's /data volume, so updating a client can never lose anything.
Settings reset after an update? Your /data mount isn't persistent — use a named volume or a fixed host path (not an anonymous volume), and on Plesk point DATA_DIR outside the deploy directory.
The dashboard footer shows the running build — a release tag (v1.2.3) on a tagged image, otherwise the branch name. Compare it against the latest release.
Managed hosting (optional add-on)
Self-hosting is the default — the whole page above is the self-hosted path, and it stays free of any hosting fee. But if you'd rather not run a server at all, managed hosting is an optional +£15/mo add-on to any plan: we run the board for you, so there's nothing to install, update or keep alive. It's the one arrangement where your board's data lives on infrastructure we operate rather than yours — a deliberate, informed trade, spelled out below.
- Your own isolated instance. Each customer gets a dedicated instance in a UK/EU region — never a shared multi-tenant pool. Your secrets and helpdesk tokens are encrypted at rest just as they are on a self-hosted box.
- Your address in minutes. Your board comes up at
<slug>.nexus.joekane.org— you pick the<slug>— with HTTPS handled for you, so there's no reverse proxy or certificate to set up. - Custom domains. Prefer your own hostname (e.g.
wallboard.yourcompany.com)? Point aCNAMEat your instance and we issue and renew the TLS certificate for it automatically. - UK/EU region. Hosted instances — and the operational data they process — stay in a UK/EU region.
- We're the processor for hosted data. Because we operate the instance, we act as your data processor for the helpdesk and operational data your board reads, under our subscription terms — see the privacy policy. On a self-hosted install we're neither controller nor processor of that data; nothing operational reaches us.
- Same 14-day trial. Hosting follows the same trial and billing as every plan — a card starts it, you're only charged if you keep it.
Telemetry on a hosted board. Because we run it, a hosted instance checks in about every five minutes and this can't be opted out of. The payload is still exactly { licenceId, version, plan, provider, instanceName? }. There is no hosted flag, uptime, health status, provider reachability, error count or error string — and never ticket content, credentials, customer data or anything that identifies one of your end-customers. The service adds a last-seen timestamp when it stores the beacon, which lets us detect a silent board. Full detail is on the privacy and security pages.
Moving back to self-hosting. You're never locked in. Export your board's /data (settings, encrypted secrets, history and branding) from the hosted instance, drop it onto a Docker deployment of your own, re-point your DNS, and cancel the hosting add-on — your licence and plan carry straight over, because the same build runs both ways. Ask us and we'll help with the export.
Hosting is a convenience add-on, not a different product. If keeping your data on your own infrastructure matters, self-host — it's the default and the honest recommendation. Hosting is there for teams who'd simply rather we ran it.
Billing
Plans
Nexus comes in three tiers. Every plan includes your live helpdesk, the core board, all 11 themes (plus custom) and TV mode — higher tiers add panels, history, automation, and access control.

- Starter — £29/mo: a single team putting their helpdesk on one screen. 1 dashboard, all core panels, KPI strip, goals & gauges, all 11 themes, TV mode.
- Pro — £59/mo: growing desks that want goals, history and a bit of competition. Everything in Starter, plus leaderboard gamification, goals/gamification panels, calculated (formula-built) KPIs, board history & burn-down, webhook alerts, mobile push alerts, scheduled chat digests, a scheduled emailed PDF report, multiple dashboards, TV loop, scheduling, layout presets, and the bundled Zendesk app.
- Enterprise — £119/mo: multi-team operations with access control and SSO. Everything in Pro, plus client-scoped access links, view-only / admin share links with expiry, named user accounts & roles, SSO / reverse-proxy auth, embeddable / public dashboards, an admin audit trail, custom connectors, business-hours First Response, SLA war-room, priority support, onboarding and DPA. Switchboard auto-routing (public beta) is included with Enterprise.
Annual billing saves around two months on Starter and Pro (Enterprise is £1,100/year). Managed hosting is an optional +£15/mo add-on to any plan — we run the board for you. See the pricing page for current prices and to subscribe.
Licence required: without a valid licence the board shows a full-screen lock. With a licence, your tier determines which features are available — locked panels and settings show an "Upgrade" nudge. Features unlock on the next licence refresh, or instantly via Refresh licence in Settings. The server also refuses gated API calls (history, alert tests, digests, access-link creation) on lower tiers.
Every plan starts with a 14-day free trial of the full board on your own data — a card starts it, you're reminded before it ends, and you're only billed if you keep it. Prefer to look first without signing up? Explore the whole board for free in demo mode — realistic sample data, every panel and theme, no account needed.
Billing & the customer portal
Your free trial: every plan starts with a 14-day free trial. Stripe Checkout takes a card up front to start it but doesn’t charge until the trial ends; you’ll get a reminder in the final few days, and you can cancel any time before then from the Customer Portal at no cost. Keep it, and the first charge lands automatically when the trial ends — your board carries on without interruption.
Billing runs through Stripe, so upgrades, downgrades, payment methods and invoices are all self-serve. Use the Stripe Customer Portal to update your card, download invoices, change plan or cancel. Reach it from the in-app Upgrade button and from every locked-feature nudge in the board.
Change plan any time in the portal — Stripe handles proration automatically. After a change, features update on the next daily licence refresh, or instantly via Refresh licence in Settings.
Updates: every update surface — the desktop auto-updater, the release feed, the in-app update check — is open; no licence check stands between a screen and a new build. Your subscription gates features, not updates.
- Server (Docker): Settings → About & updates tells you when a newer release exists; updating is a
docker compose pull && up -d(or your panel's re-pull + recreate — see Updating). - Desktop: the Electron shell downloads in the background and offers to restart.
- Mobile: iOS updates arrive through the App Store; on Android install the latest APK over the top.
Billing emails: you'll receive your activation token when you start; a reminder a few days before your free trial ends; renewal receipts and payment-failed retries; confirmation on cancellation; and if you ever lose your token, just get in touch — I’ll send it over.
Cancelling: cancel any time from the Customer Portal. Your board keeps working through the period you've paid for (plus the 3-day grace); once the subscription ends, Nexus stops re-issuing keys and the board shows the full-screen lock until a valid licence is supplied again. (Updates themselves stay open — it's the licence that lapses, not your access to new builds.)
Help
Troubleshooting
Stuck? Send a report straight from the board — ⚙ Settings → About & updates → Report a problem. It includes your version, plan and provider automatically (and nothing else), goes directly to the developer, and you can add an email if you'd like a reply.

Most issues come down to persistence, ports or access. Here are the common ones and their fixes, grouped — open the area you're stuck in.
Deployment & Docker
- Port conflict on start (
address already in use) — another service holds the host port. Change the left-hand port number in the mapping (e.g.3002:3001) and reverse-proxy to it. You don’t need to change the container’s internal port. GLIBC_2.28 not found (required by node)— the OS is too old for Node 18+. Use the Docker image — it bundles Node 26 and a modern glibc so it runs even on CentOS/CloudLinux 7.nodenv: command not foundin Plesk Git deployment actions — install/build over SSH or switch to Docker.- Blank page / 503 — make sure the web build ran (the server serves
apps/web/dist) and the app/container restarted after the build. Confirm the health endpoint:
curl http://localhost:3001/api/health
# → {"status":"ok"}   (any other response = server not running)

docker logs nexus --tail 100    # check startup errors
docker ps                       # check the container is actually running
- Container keeps restarting — run
docker logs nexusand look for the last error. Common causes: missingDASHBOARD_SECRET_PASSPHRASEon Linux, a port already in use, or the/datapath not being writable. - Reverse proxy returns 502 or times out — confirm the container is reachable on the host before adding the proxy. Test directly:
curl http://localhost:3001/api/health. For WebSocket-aware proxies (nginx), include theUpgradeandConnectionheaders — see the VPS section nginx snippet.
Setup wizard issues
- Wizard keeps reappearing after "Finish setup" — the settings did not save. Check the browser console for a network error. Confirm the server is running (
/api/health) and that the/datadirectory is writable by the container. - "Next" button stays grey on the Ticketing step — every required field for your provider must be filled: Zendesk needs subdomain + email + API token, Freshdesk/Freshservice a domain + API key, Jira a site + email + token, HaloPSA a URL + client id + secret, SuperOps a data centre + subdomain + API token, NinjaOne a region + client id + secret, ConnectWise PSA an API host + company id + public/private key + client id (optional fields like Jira's project or Halo's tenant never block). Secret fields show
••••while you type — that's normal. - Wizard shows "Setup unavailable" — the server could not load setup data. Check
/api/healthand the server logs.
Settings & data
- Settings reset after an update — your
/datamount isn’t persistent. Use a named volume or a fixed host path (not an anonymous volume), and on Plesk pointDATA_DIRoutside the deploy directory. Back up that path — it holds encrypted secrets, layout and history. - Stored tokens won’t decrypt — on Linux/macOS, secrets are encrypted with
DASHBOARD_SECRET_PASSPHRASE. If it changed or was lost, re-enter credentials in the wizard (they will be re-encrypted with the new passphrase). Keep the passphrase stable and backed up alongside the/datavolume.
Provider & data
- No data / connection fails — re-check your subdomain (just the hostname segment, no
.zendesk.com), agent email and API token in the wizard. The agent account must have access to the data you are showing. For Talk panels, the agent needs a Talk licence on their seat. - 401 errors in the browser console — the credential was entered incorrectly. Regenerate it at your provider (Zendesk: Admin Center → APIs → Zendesk API; Freshdesk/Freshservice: Profile settings; Jira: id.atlassian.com API tokens; Halo: the API application) and re-enter it in the wizard.
- The "Last 30 days" view feels slow or rate-limited — that trend issues one search per day, which is heavier on your provider’s search rate limit (Zendesk and Freshdesk both cap search). Stick to shorter ranges (e.g. "This week") on high-volume accounts.
- A monitoring vendor shows the wrong client count (or none) — hit Test connection in that vendor's card under Settings → Monitoring; it reports live whether the credentials work and how many clients it can see, so you can tell a credential problem from an empty estate.
Clients
- Windows SmartScreen blocks the desktop installer — builds are unsigned. Click More info on the SmartScreen dialog, then Run anyway. See Install & first launch.
- macOS Gatekeeper blocks the .dmg — builds are unsigned. Right-click the Nexus icon in Applications and choose Open, then click Open in the dialog. See Install & first launch.
- The phone app can’t reach a plain-HTTP LAN server — both the iOS app and the released Android APK are HTTPS-only (no cleartext). Use a server URL that starts with
https://— run Nexus behind TLS / a reverse proxy with a Let's Encrypt cert. - No fullscreen button in the Zendesk app — expected; Zendesk deliberately disables the Fullscreen API for app iframes. Use the desktop app or a browser for kiosk/TV deployment.
- Desktop app shows a blank/error screen — the server URL may be wrong or unreachable. Open the Nexus menu → Change server… and correct the URL. Confirm the server is up with
curl <server-url>/api/health.
Licensing
- The board shows a full-screen lock — no valid licence is loaded. Open ⚙ Settings → Licence, paste your activation token (
act_…) or signed key (NXS1.…), and click Activate / refresh licence. See Activate your licence or use Demo mode for sample data. - I lost my activation token — get in touch from the address you subscribed with and I’ll send it straight over.
- I upgraded but the new features are still locked — click Refresh licence in ⚙ Settings → Licence to fetch a fresh key immediately. If a specific panel or API call is still blocked after refreshing, verify your plan includes that feature — see Plans.
- Board locked with "stale" reason — the last successful heartbeat was more than 7 days ago (the server cannot reach the licence service). Check outbound internet connectivity from the server host, then click Refresh licence.
- Zendesk app shows "Licence in use elsewhere" — the licence is already bound to the maximum number of Zendesk accounts (default: 2). Contact us to reset the binding.
FAQ
- Is Nexus self-hosted? Yes. You run the server; all your data stays on its
./datavolume. The only serverless surface is the Zendesk app, which reads from your Zendesk account directly via your agent session. - Do I need a Mac to build the apps? No. Releases are built in CI for every platform — Windows, macOS, Linux, Android and the Zendesk app — and iOS ships on the App Store. Just download from Releases.
- Will updating lose my dashboards or settings? No. Clients are stateless renderers and the server’s data is on a persistent volume, so updating any client or the server is non-destructive.
- Can I put the board on the public internet? Read access is unauthenticated by default, so don’t expose it directly. Keep it on a LAN or behind a VPN/SSO, set a passcode under Settings → Security & access, and use
DASHBOARD_TOKENto gate config mutations. Enterprise access links add view-only and client-scoped sharing. - Which providers are supported? Zendesk (Support + Talk) is the fully live-tested flagship; Freshdesk, Freshservice, Jira Service Management, HaloPSA, SuperOps, NinjaOne, ConnectWise PSA, Zoho Desk, Help Scout and Front are fully supported; a zero-setup Demo provider needs no account. Monitoring reads UniFi (in every plan) plus 14 more on Enterprise — Meraki, Aruba Central, Omada, SuperOps (RMM), NinjaOne (RMM), N-able, Auvik, Domotz, Acronis, Huntress, Datto RMM, Kaseya VSA, ConnectWise Automate and Liongard — a panel per connected tool.
- Still stuck? Get in touch.
Common questions
Quick answers to what people ask before subscribing. For setup and operational issues, see Troubleshooting above.
Yes. Demo mode fills the board with realistic sample data in about 30 seconds — no account needed — so you can explore every panel, theme and design before you subscribe.
Yes — every plan starts with a 14-day free trial of the full board on your own data. Starting it takes a card, so you're reminded before it ends and only charged if you decide to keep it, and you can cancel anytime. Prefer not to sign up at all? Demo mode runs the full board on sample data instantly, with no account or card.
Self-hosted (the default): Nexus runs on your server (Docker, desktop, or mobile) and reads your help desk directly, so your customer data never leaves your own infrastructure. If you choose the optional managed hosting add-on instead, your board runs on a dedicated instance we operate in a UK/EU region. API keys are encrypted at rest either way. More on the trade-offs: self-hosted vs cloud wallboards.
You start a free trial or subscribe through Stripe and get a one-time activation token. Paste it once in Settings → Licence and Nexus fetches a fresh signed key each billing period. Keys are verified offline, so a brief outage of our billing service never bricks your board — your current key stays valid until it expires.
Yes — manage or cancel from the Stripe Customer Portal. Your key remains valid until the end of the period you've paid for (plus a short grace window).
Start with the 14-day free trial, so you only pay once you've decided to keep Nexus. After that, payments aren't refundable, but you're never locked in: there's no long-term contract, you only ever pay for the period ahead, and you can cancel anytime — your licence stays active until the end of the period you've already paid for.
Annual billing charges once a year at a discount: Starter and Pro cost ten times the monthly rate (around two months free), and Enterprise is £1,100/year. You can switch between monthly and annual from the Customer Portal at renewal.
Multi-team Enterprise deployments and registered non-profits can be quoted individually — get in touch and we'll sort something out.
A machine that can run Docker (or the self-contained desktop app), and a supported help desk account — Zendesk is fully live-tested, with Freshdesk, Freshservice, Jira Service Management, HaloPSA, SuperOps, NinjaOne, ConnectWise PSA, Zoho Desk, Help Scout and Front (or start with zero-setup demo mode). The first-run setup wizard walks you through connecting it; multi-vendor Monitoring (UniFi and more) and AI summaries are optional add-ons.
One codebase ships to web, desktop (Windows/macOS/Linux), iOS and Android, and as a Zendesk Marketplace app — each keeping its own per-device layout.
We keep honest, side-by-side comparisons — see how Nexus compares, or read the detail on the Geckoboard, Zendesk Explore, Plecto, Klipfolio, Databox and Grafana alternative pages.
Yes — dedicated guides for Zendesk, Freshdesk, Freshservice, Jira Service Management, HaloPSA, SuperOps, NinjaOne and ConnectWise, plus practical how-tos in our guides.
Ready to subscribe?
Pick a plan, paste one token, and your licence renews itself.