 Nexus
Nexus50
Panels & insights
Live Zendesk, Freshdesk, Freshservice, Jira Service Management, HaloPSA, SuperOps, NinjaOne, ConnectWise PSA, Zoho Desk, Help Scout or Front, goals that motivate, analytics that explain — themed for any room and self-hosted on your terms.

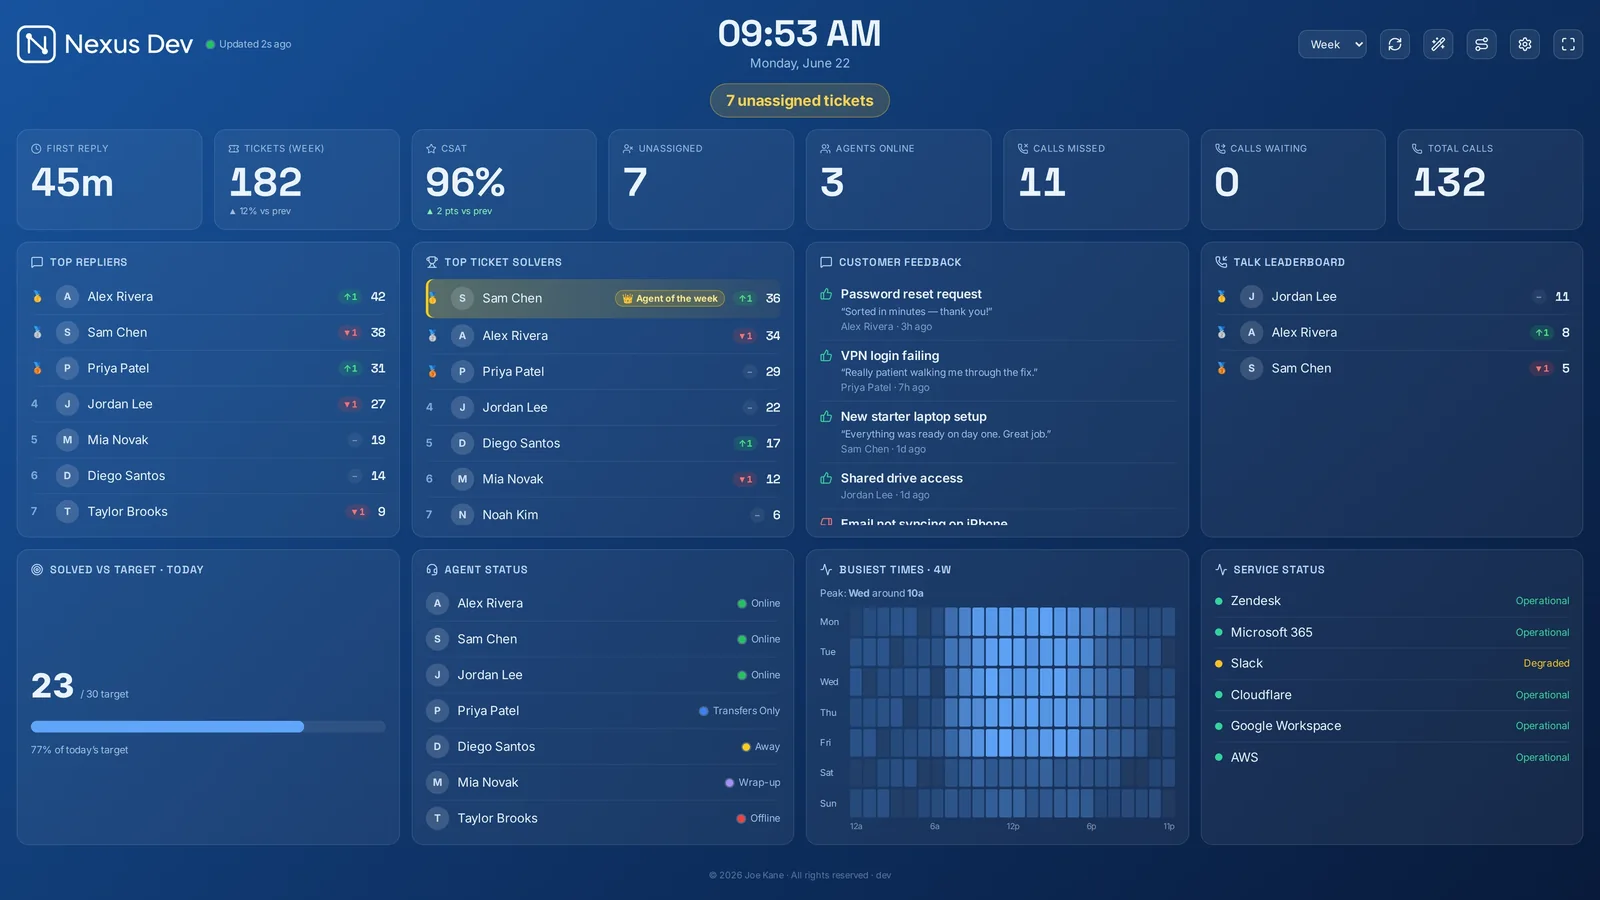
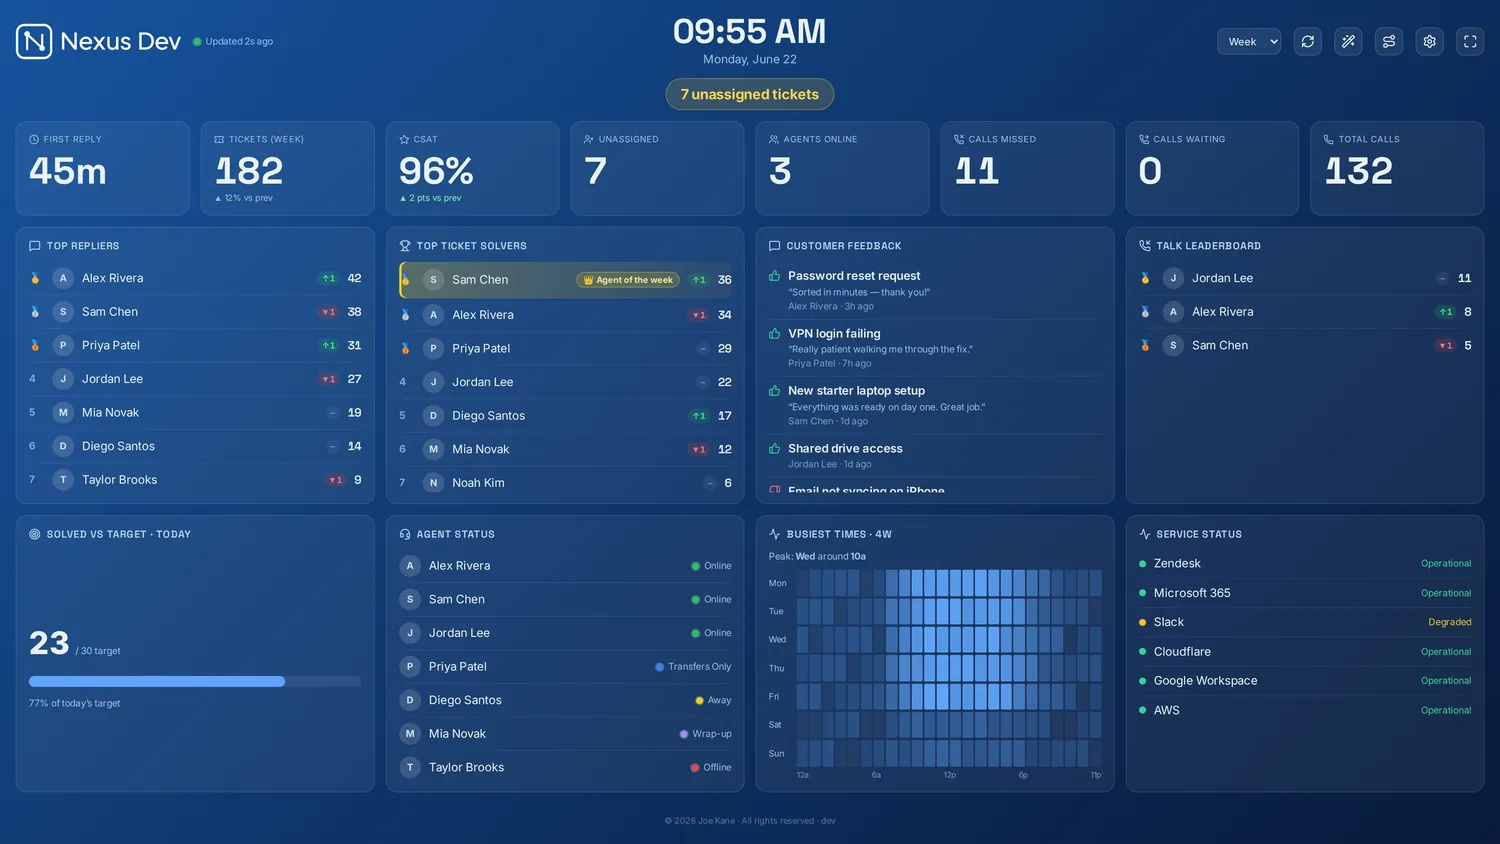
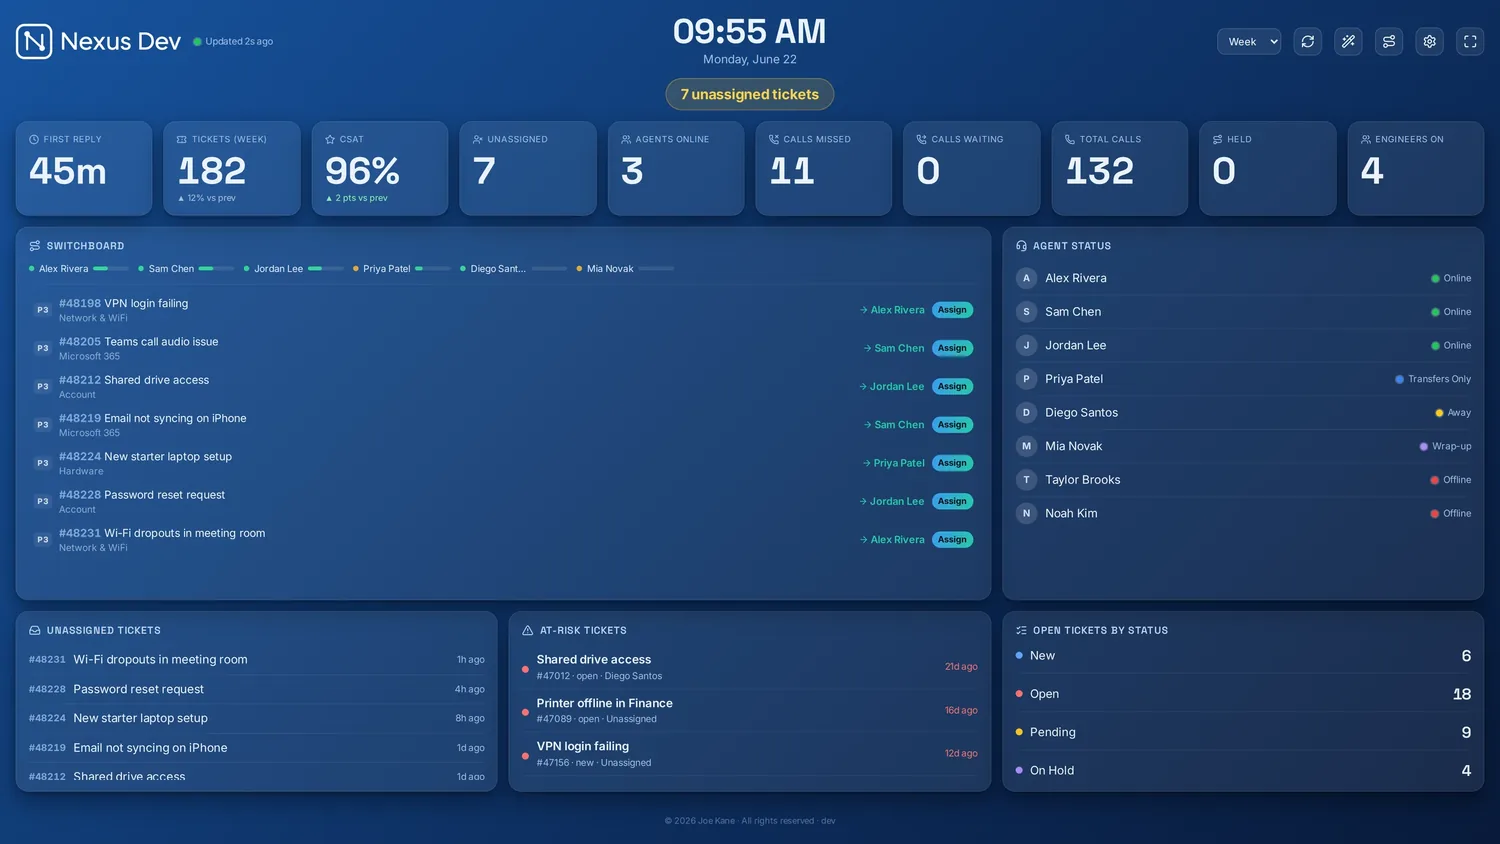
A live board on a wall TV — KPIs up top, people and ticket panels below, a busiest-times heatmap and service status. Shown on the Ocean theme with the Glass look; every panel is yours to toggle, resize and theme.
Live SLA countdowns, war-room takeover, smart anomaly alerts and thresholds that calm down.
Goals, leaderboards, CSAT and Agent of the Week — up on the wall.
Wall TVs, desks, phones, desktop and inside Zendesk — one codebase.
Self-hosted on your own server; nothing leaves your network.
A fullscreen-scaling layout adapts to any surface. Drag panels to reorder, grab a corner to resize, lock it for a public screen, and switch between grouped one-click layout presets.
Goal-tracked KPIs with RAG status, leaderboard gamification, an agent-of-the-week crown, and a team-goal thermometer — with confetti when the target falls. Make it yours with a remixable design system: 11 colour themes, six panel looks, and eight Designs that restyle the whole board — Loud, Status Board, Control Room, Aurora and more, each with its own background, typography and chrome. Every combination is yours, set per screen or per dashboard — and board styles can swap the dashboard entirely.
Backlog burn-down, a busiest-times heatmap, reopen rate and first-contact resolution, top tags, streaks and badges — plus persisted history so trends survive restarts.
Tiered refresh keeps Talk live at 20 seconds, tickets at 60, aggregates at five minutes. Loop named boards on a TV, trigger a full-screen war-room takeover, and drill into any number with a click.
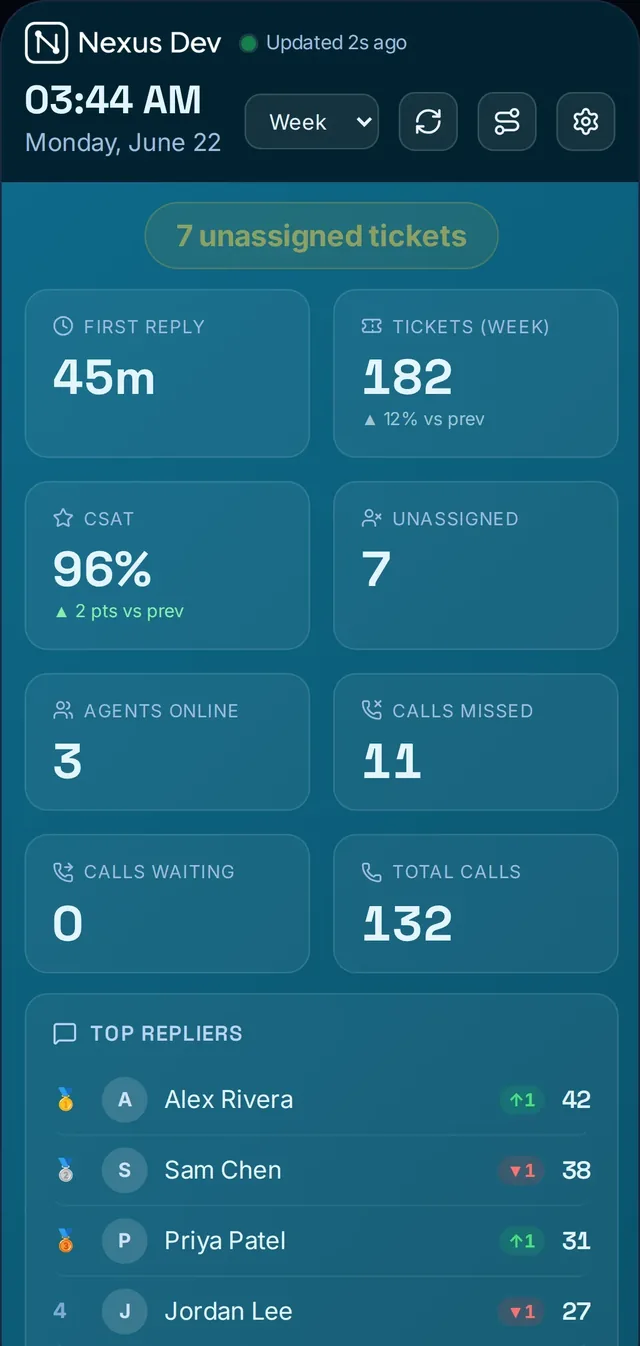
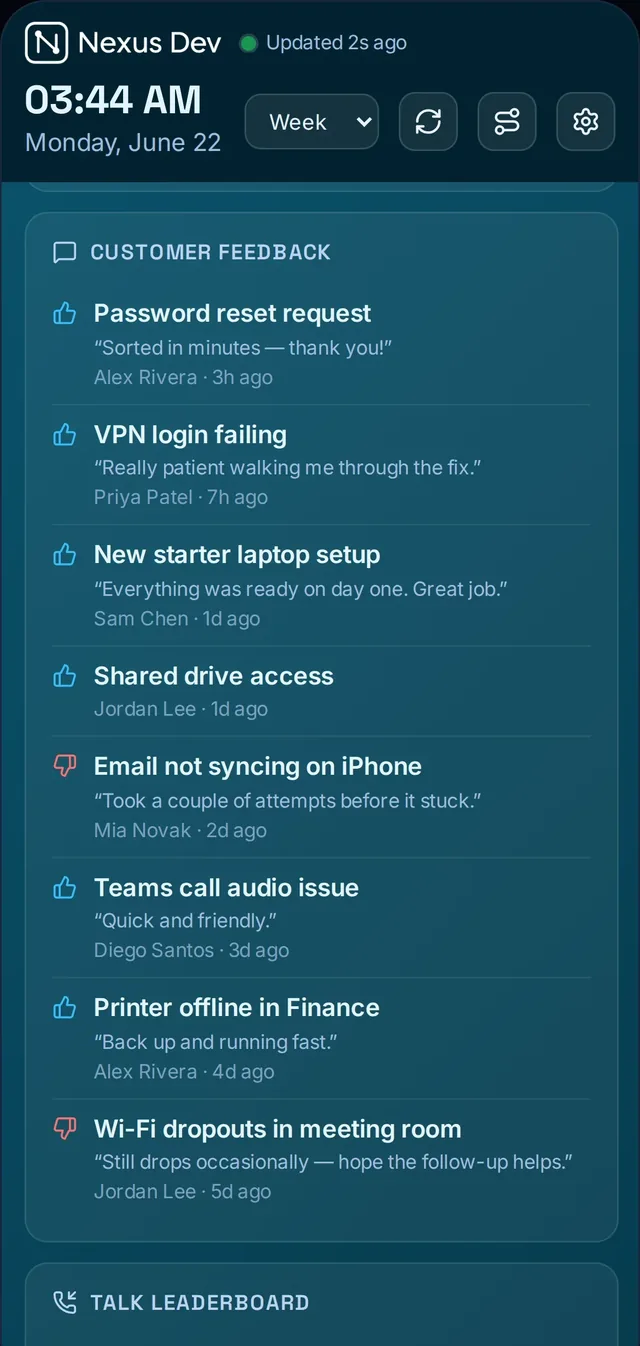
The same board reflows to a single column of KPI tiles and leaderboards — each device keeps its own layout, so the on-call view is yours and the wall stays the wall.
Themes, looks and designs restyle your board. A board style goes further — one click swaps the whole dashboard for a purpose-built screen. Keep the configurable Standard board, build your own with the new drag-and-drop Canvas, or drop in a neon HUD, a retro terminal, a competitive leaderboard or a mission-control NOC wall. Every one reads the same live helpdesk data, recolours to your theme and wears your logo.
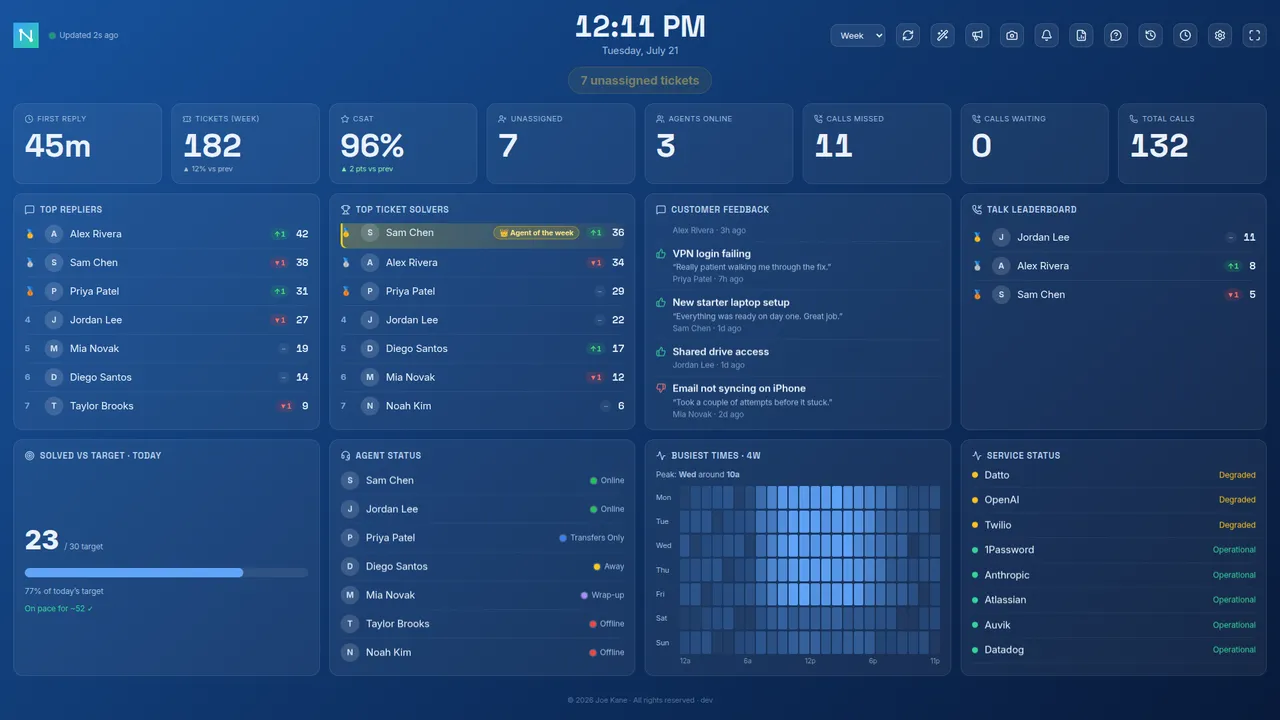
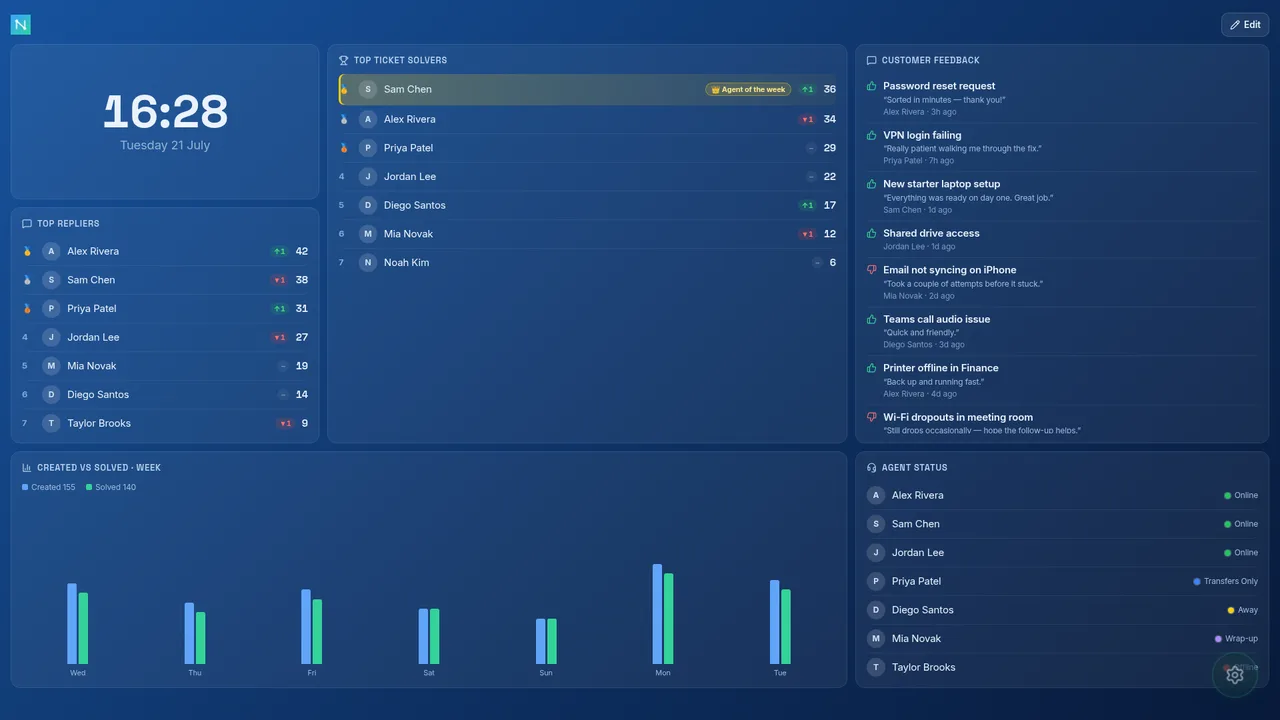
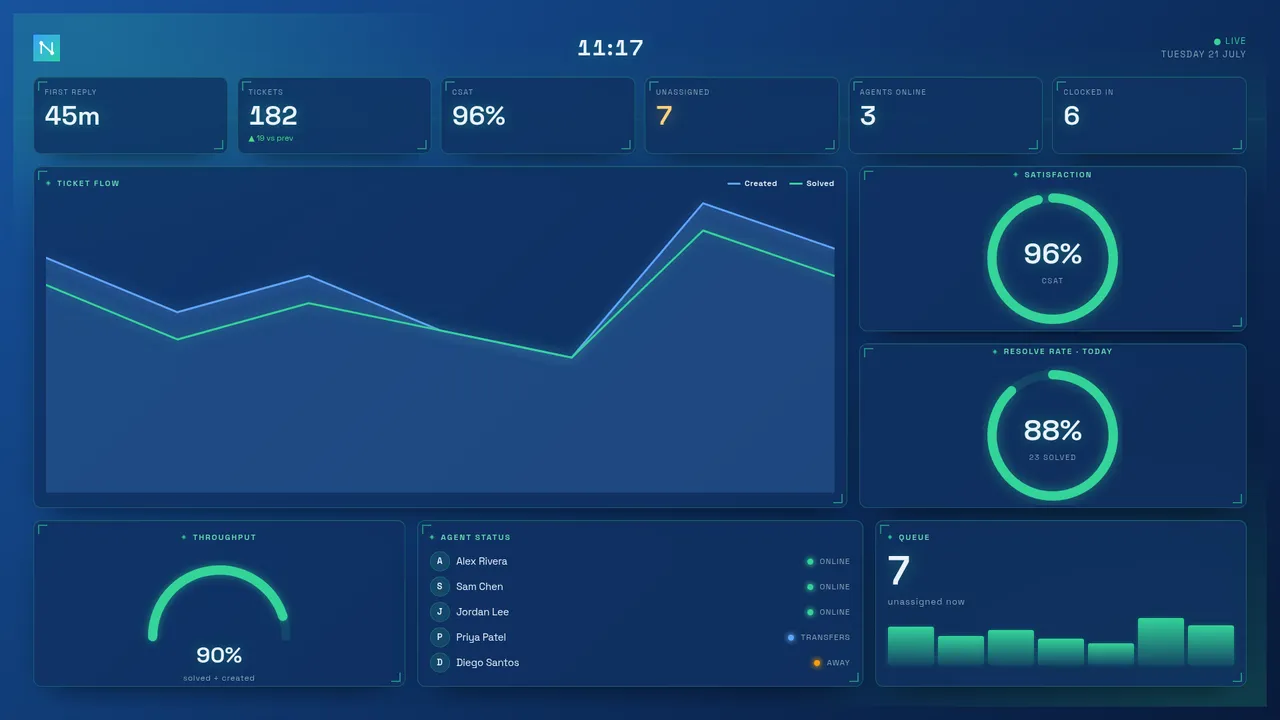
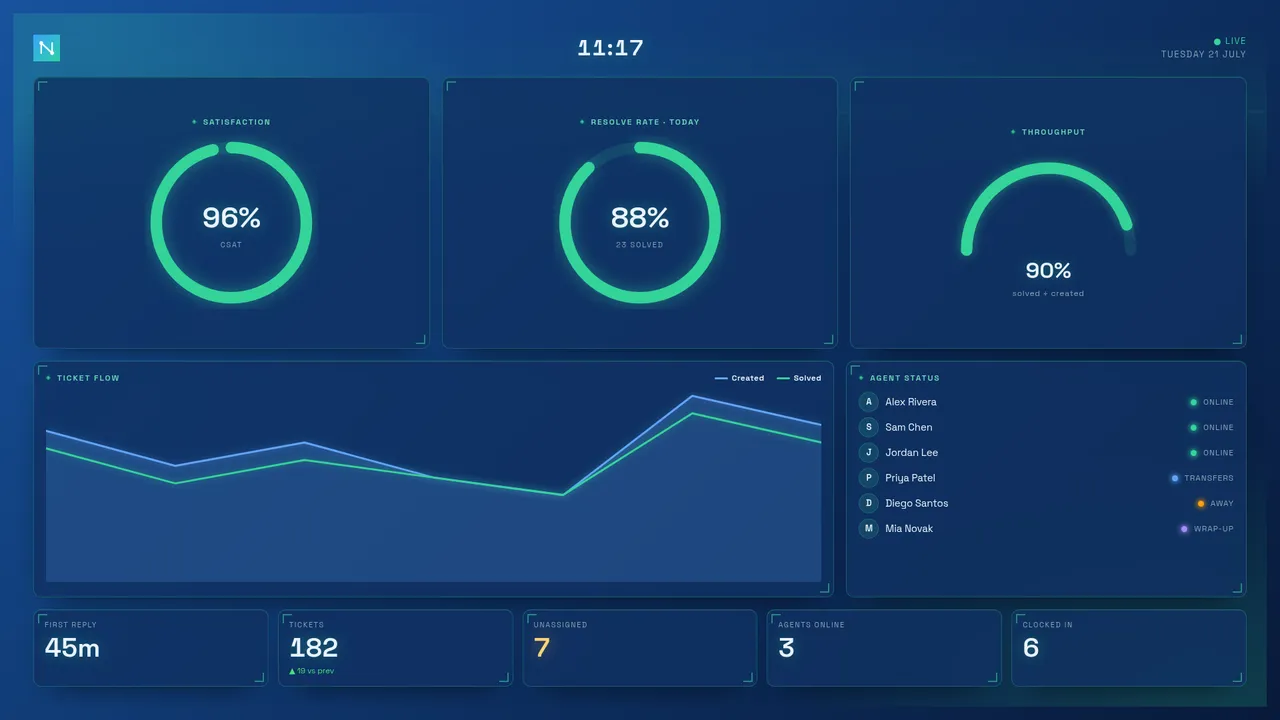
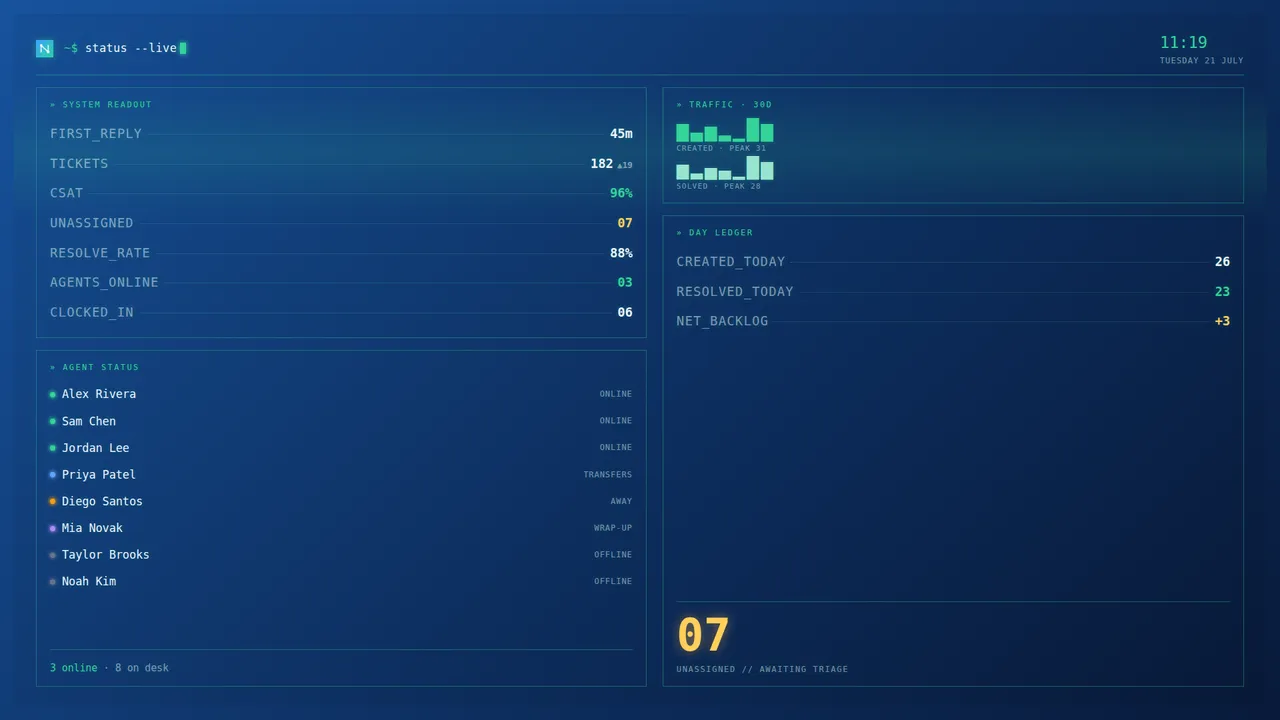
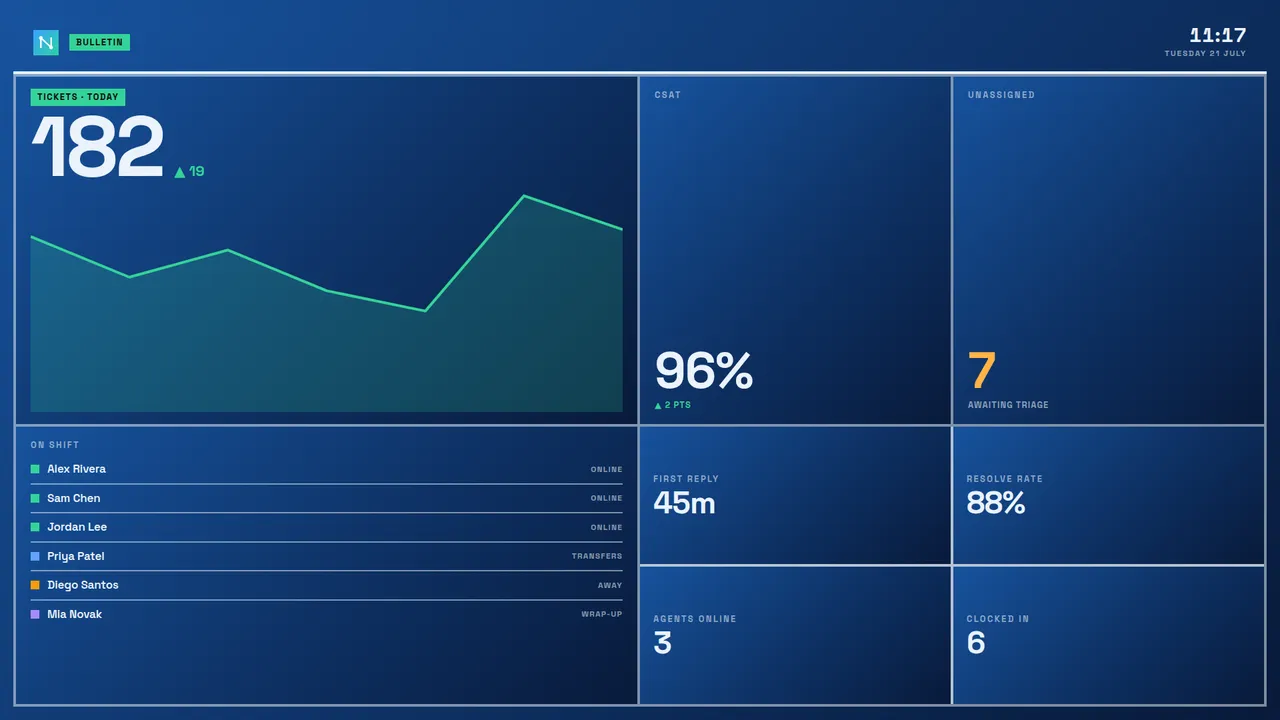
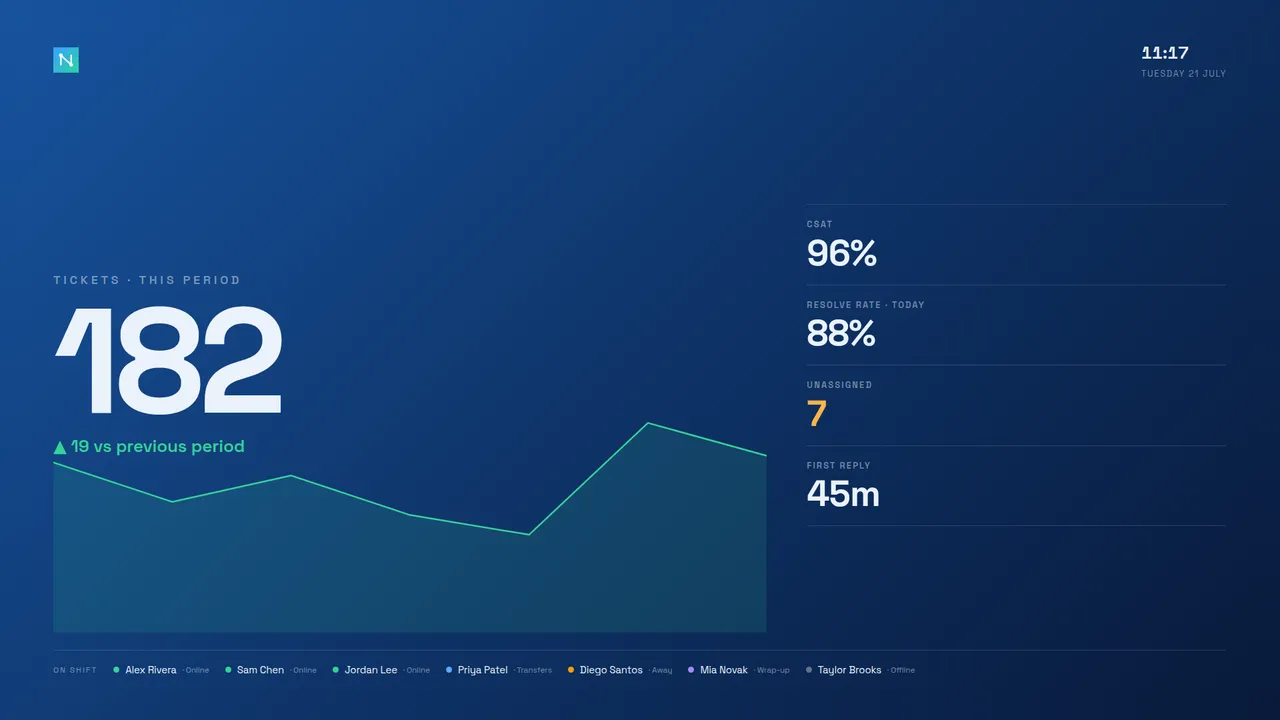
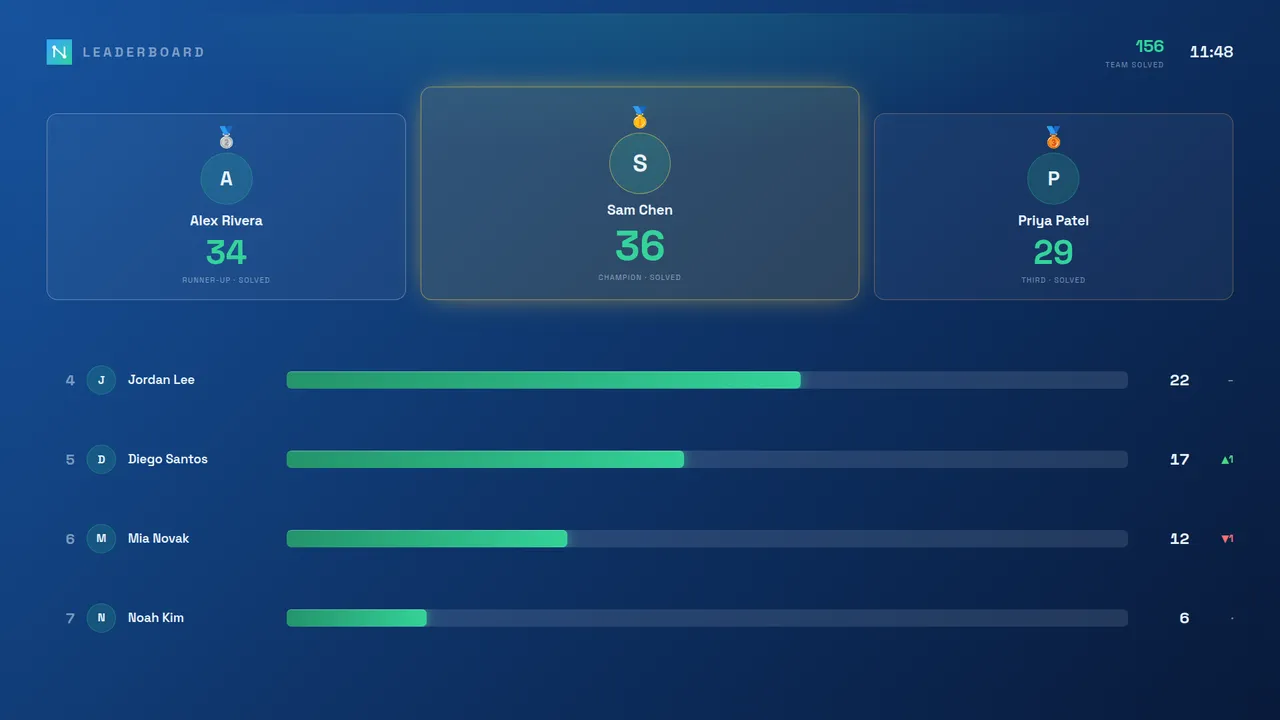
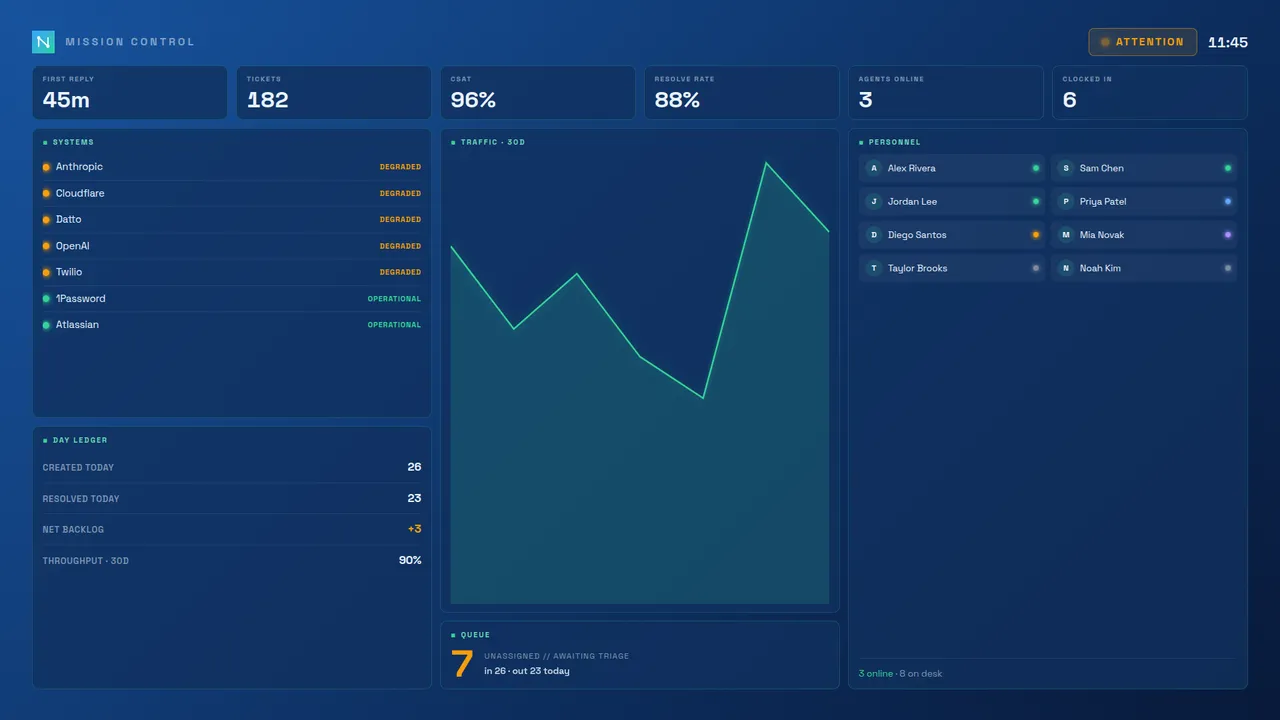
Set per screen under Settings → Appearance → Dashboard — the reception TV can run the leaderboard while the ops desk runs a HUD. Board-styles guide →
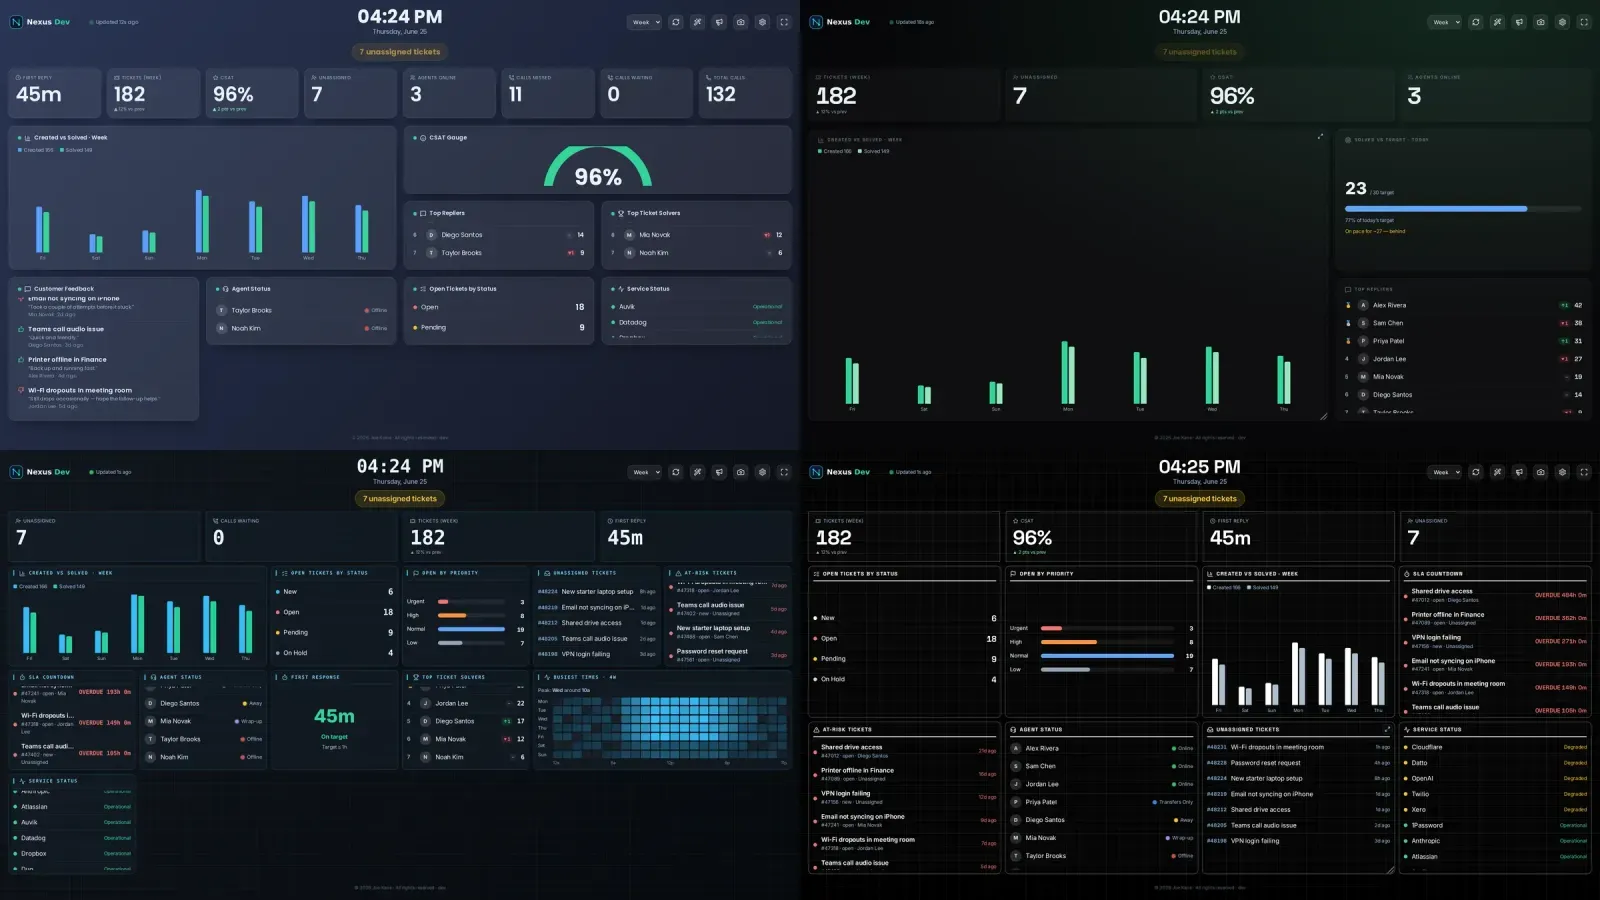
Board styles are theme-aware, not fixed palettes. The same dashboard takes on whichever of the 11 colour themes the screen is set to — accent, chart series and background all follow — so "a completely different dashboard" still matches your brand and the room it hangs in. Here's the one Flux HUD on three themes, plus Mission Control on a fourth.
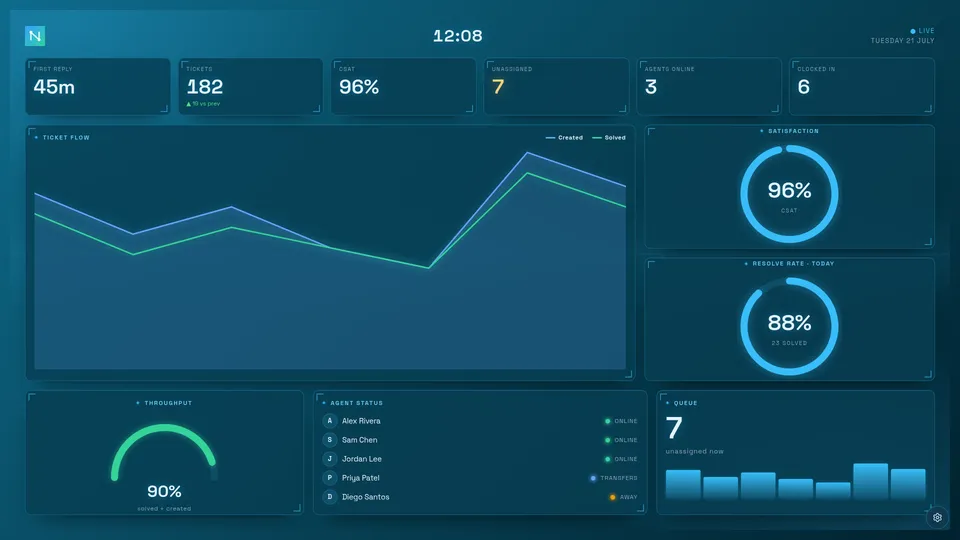
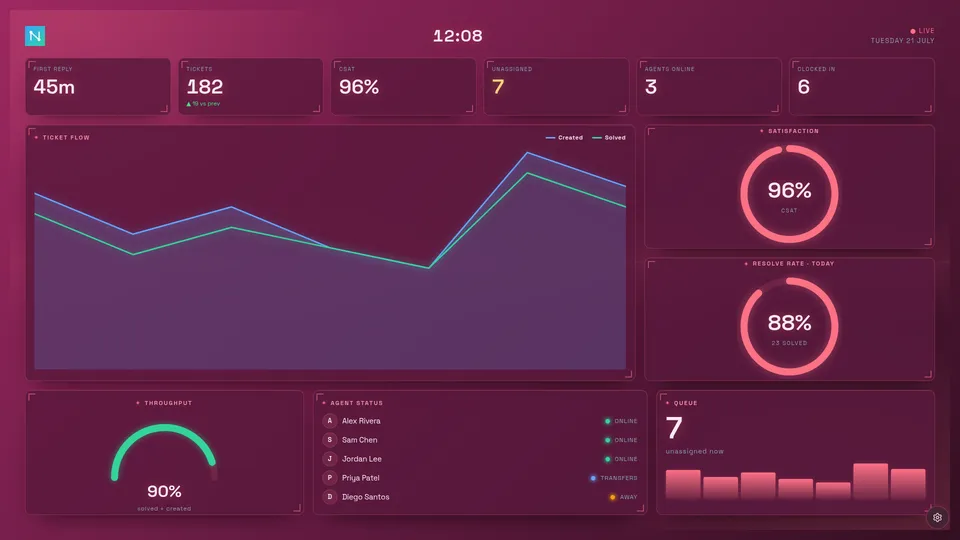
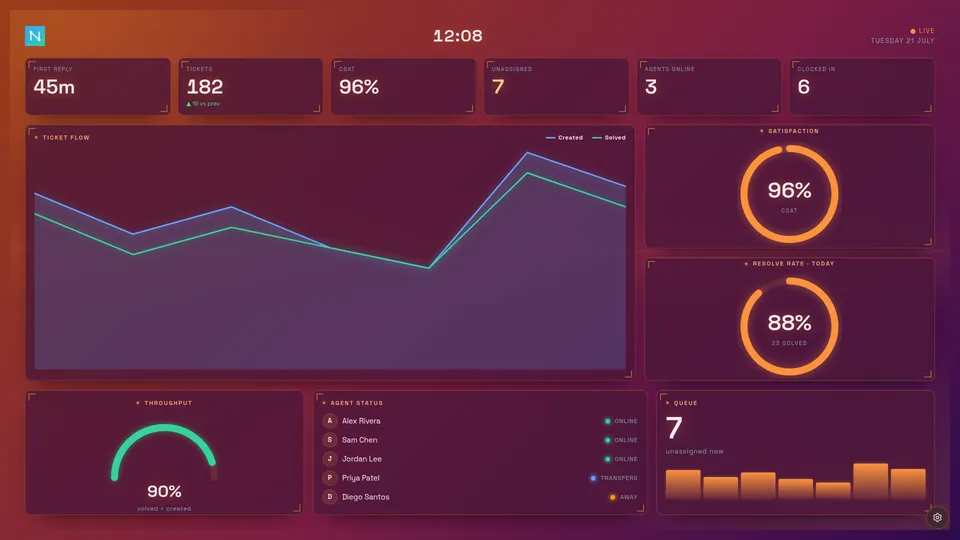
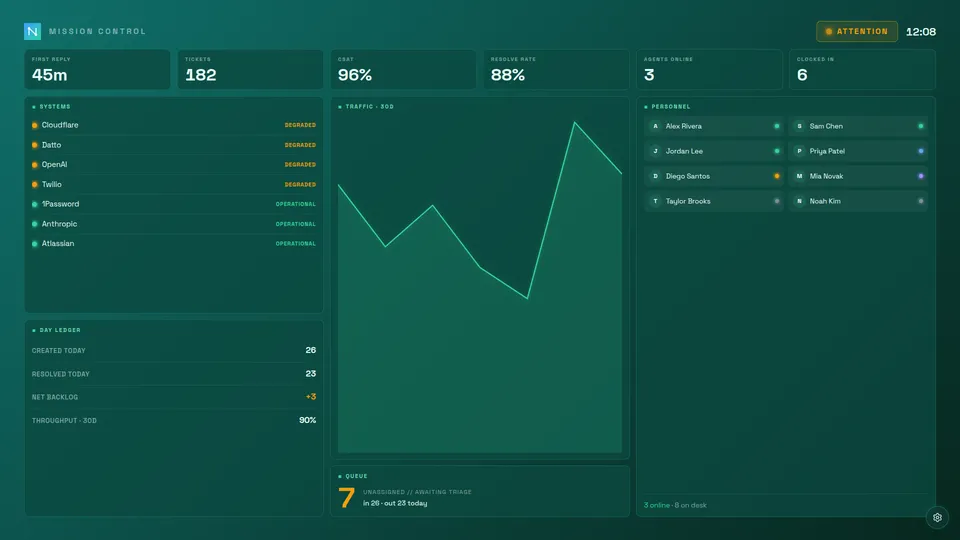
Zendesk Support + Talk, fully live-tested — and the same board reads ten more desks. Pick yours in the wizard.
Dedicated guides: Zendesk · Freshdesk · Freshservice · Jira Service Management · HaloPSA · SuperOps · NinjaOne · ConnectWise · Zoho Desk · Help Scout · Front wallboards
By use case: call centre · IT helpdesk · customer service wallboards
Per-client health next to your support numbers, perfect for MSP/IT walls. Set up as many as you like and each gets its own panel, shown only once it's connected. UniFi is live-tested and in every plan; the cloud network, RMM, backup and security vendors come with Enterprise.
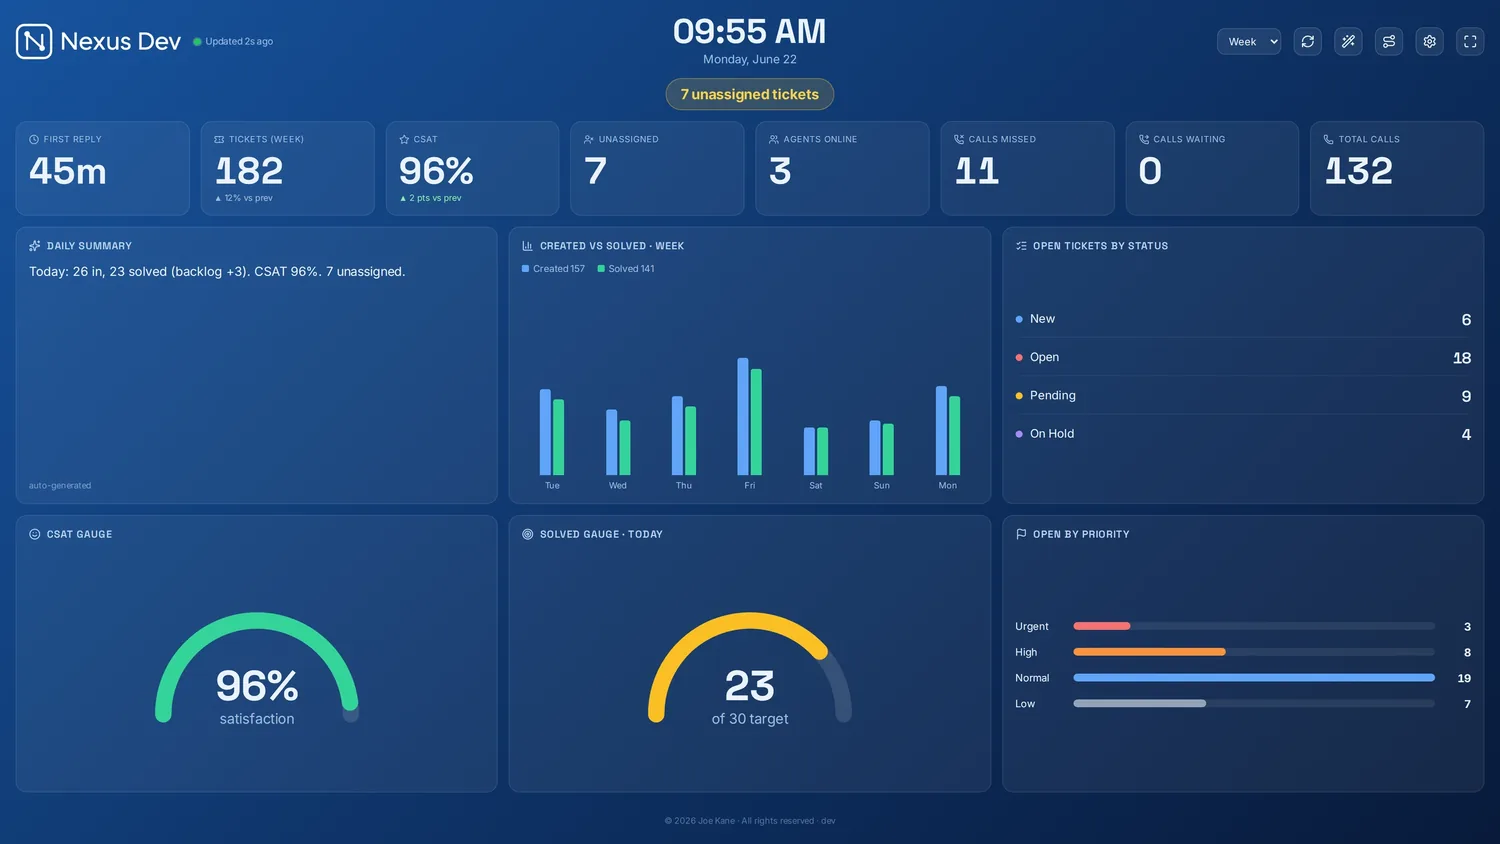
An optional LLM writes a plain-English daily summary on the board, opens the end-of-day digest with a one-sentence read, narrates your reports — and answers questions about your desk in the Ask-the-board box.
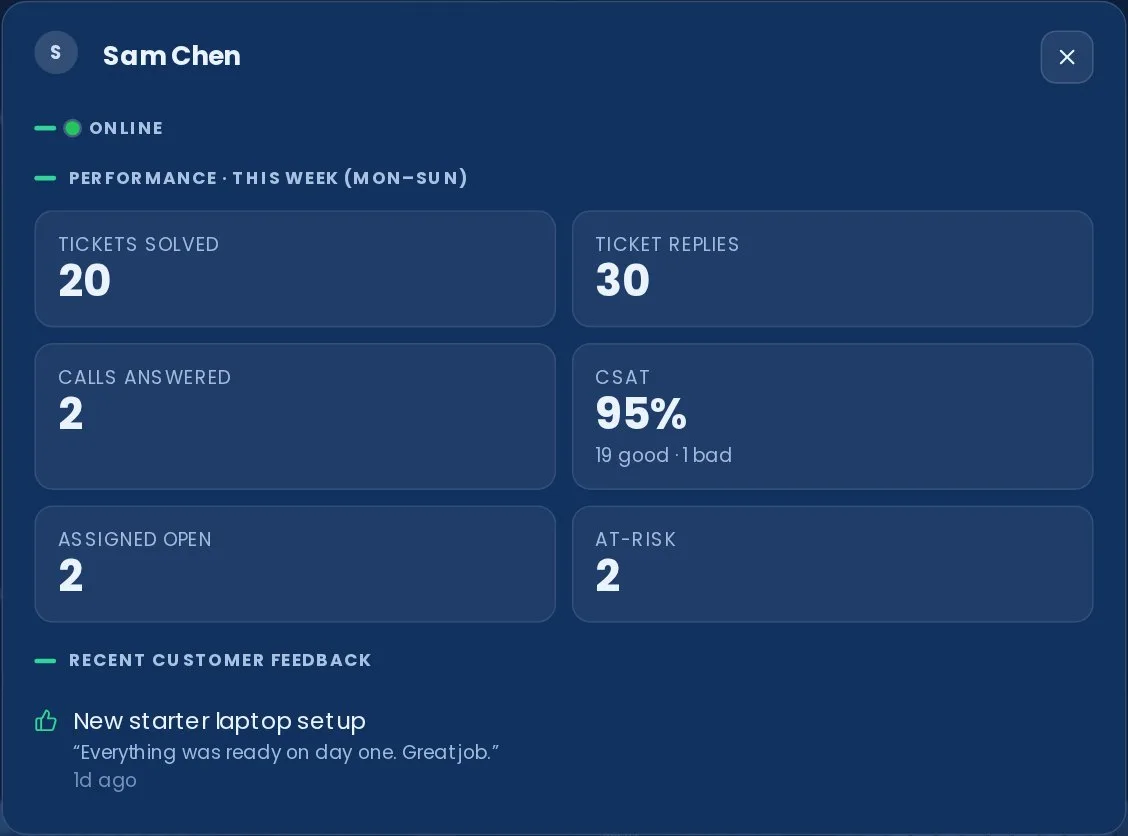
Every agent on the board is a door, not a label. Tap anyone — on the leaderboard, the status panel, anywhere — and their drill-down opens: tickets solved, replies sent, calls answered, what's still open on their plate and what's about to breach.
Per-agent CSAT shows who's delighting customers, not just who's closing fastest. The week's top performer earns the Agent of the Week crown on the board itself, streaks & badges reward consistency — and when the team goal falls, everyone gets the confetti.
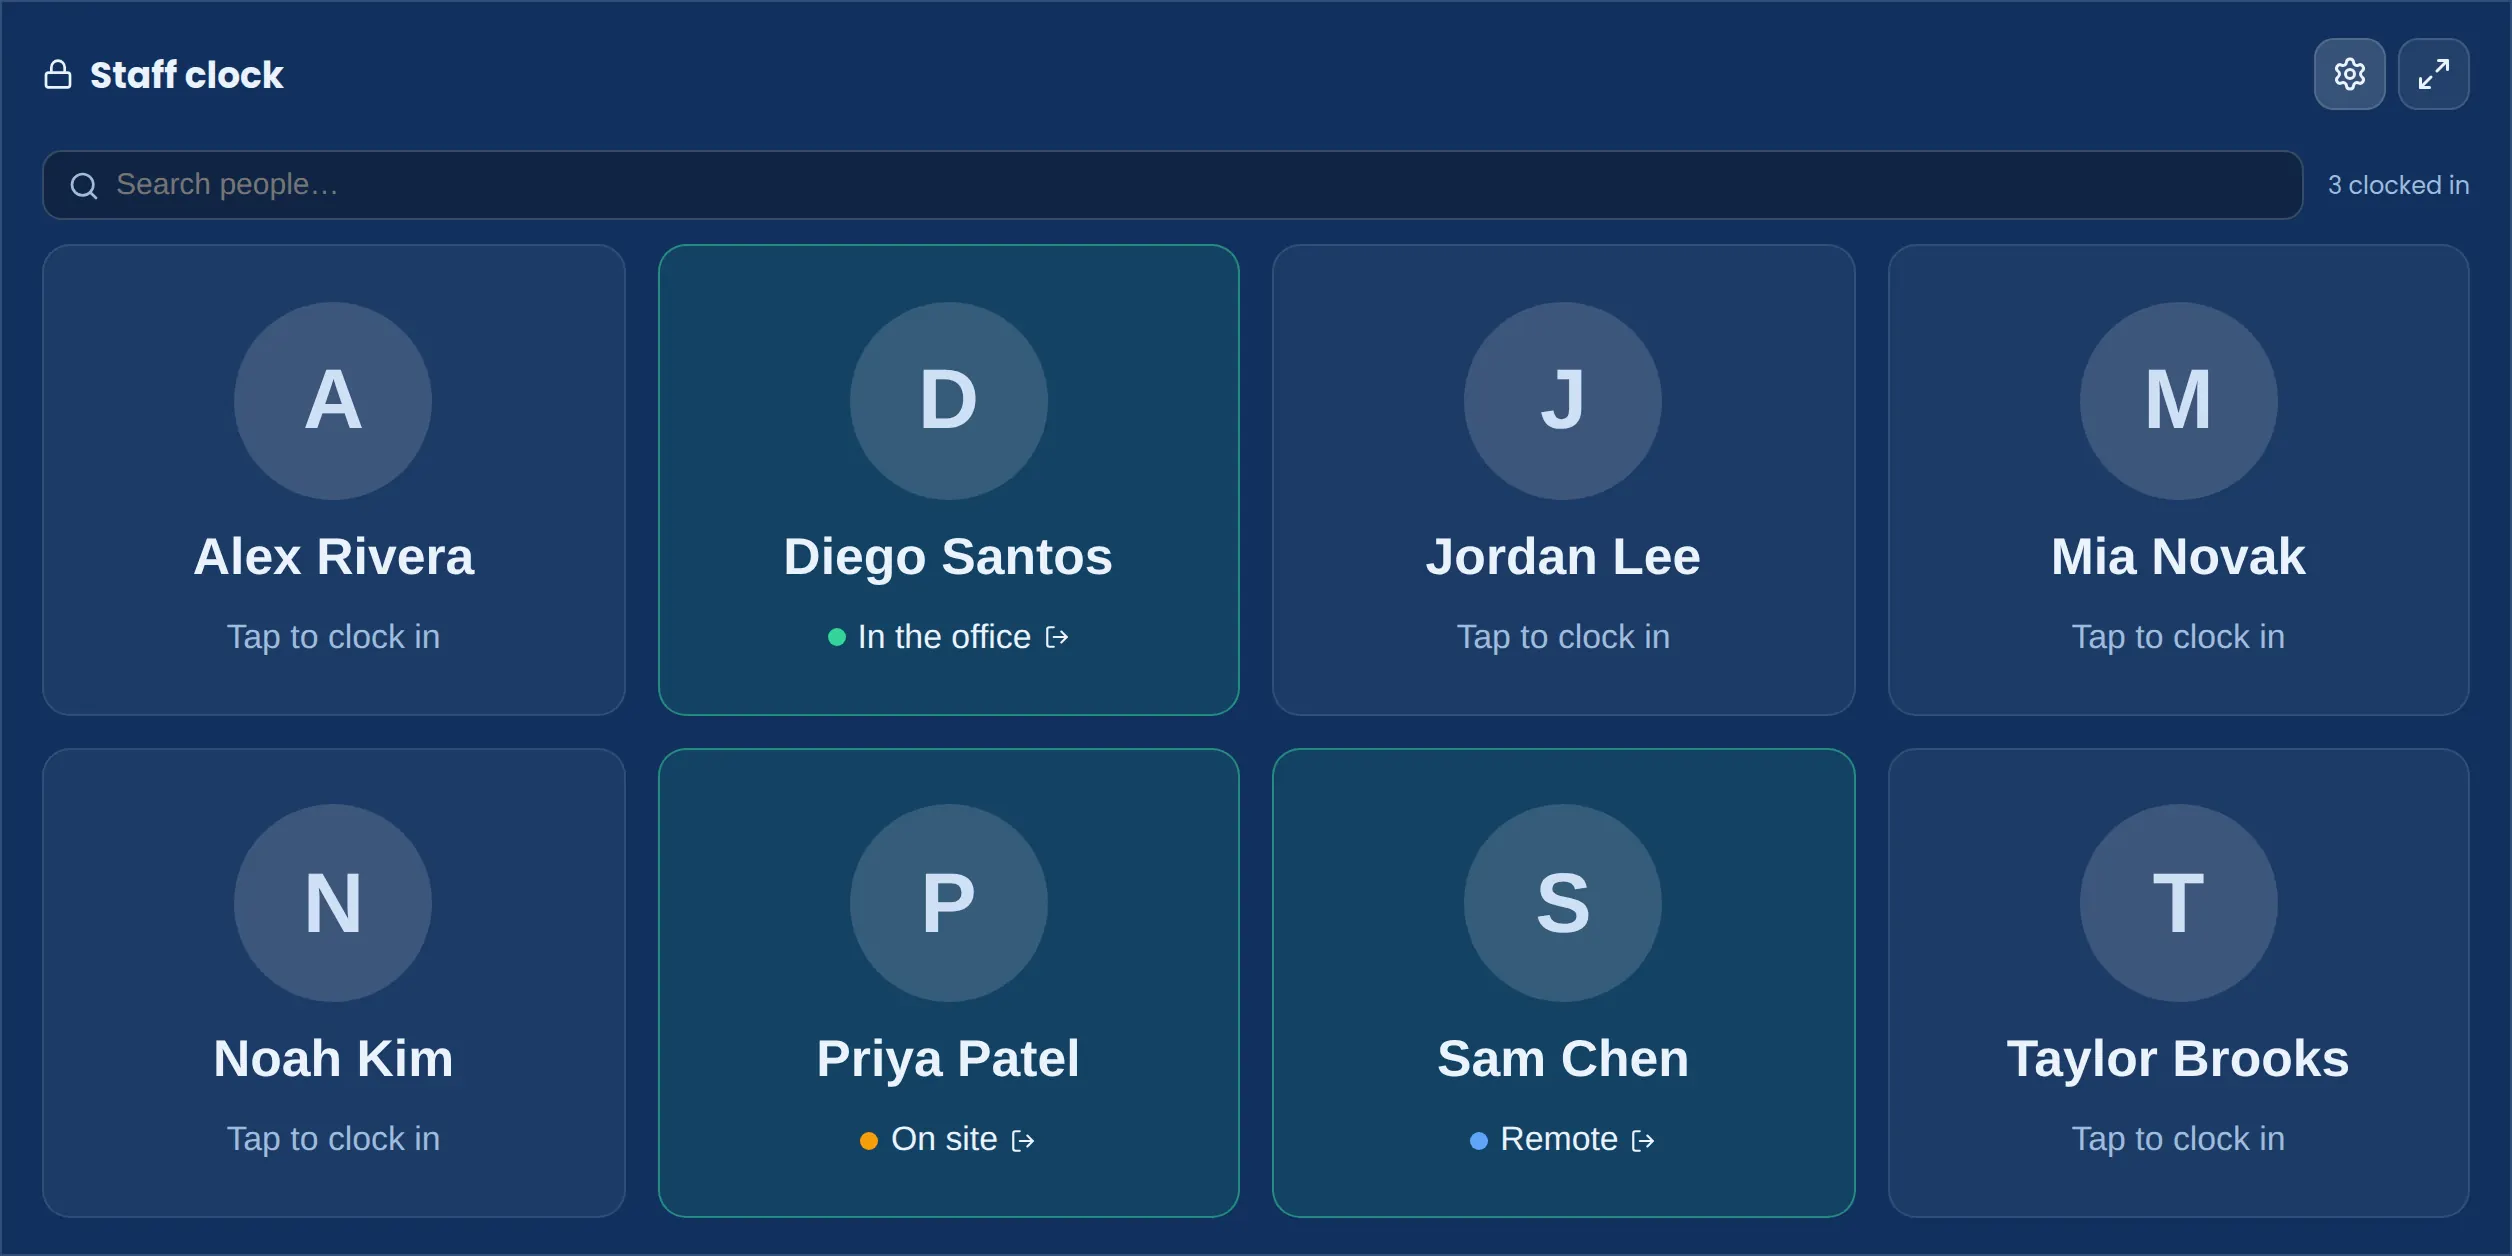
Stand a tablet by the door and let the team clock themselves in with a tap. The staff clock is a pop-up you can lock full-screen on an iPad or Android tablet — a wall of names and faces from your connected helpdesk, topped up with anyone you add by hand.
Three honest ways to be on: in the office, on site for a customer visit, or remote. On site and remote are self-service from any device; in the office can only be set from a tablet you've registered as an office kiosk, so the board's office count means someone actually tapped in there. First-run admin PIN, PIN-protected settings, and an optional wallboard panel showing who's on. Set-up guide →
Every at-risk ticket carries a live countdown to breach — sorted by urgency, impossible to miss from across the room. SLA monitoring →
When thresholds trip, the board can take over the whole screen — red, loud and unambiguous — until the queue is back under control.
Threshold webhooks to Slack, Teams or Discord with cooldowns so a flapping metric doesn't spam — and a green recovery message when it clears.
Intraday backlog sampling plus daily roll-ups that survive restarts — see whether today is actually getting better, hour by hour.
Four weeks of volume by hour and weekday. Staff the Tuesday 10am crush instead of guessing it.
First-contact resolution and reopen tracking expose quality, not just speed — the metrics CSAT follows.
What's actually driving volume this month, ranked — your roadmap for killing repeat tickets.
Every number is a doorway: tap a KPI and the tickets behind it list out, straight from your helpdesk.
Optional: a plain-English "how today went" written by an LLM (bring your own key) — or a sharp rule-based summary with none.
Keep named boards — “Floor TV”, “Manager desk”, “Calls wall” — and loop them on a rotation.
Auto-switch board and theme by time: calm overview at 8am, calls-heavy at peak, dark mode after hours.
Full-screen rotation built for wall TVs, plus an announcement ticker for the things the board can't say.
Drag panels, grab corners, apply one-click layout presets — then lock it so the public screen stays put.
Give a customer a read-only link showing only their org's tickets — isolation enforced server-side, not by hiding pixels.
The wall TV, your desk monitor and your phone each keep their own layout, theme, zoom and density.
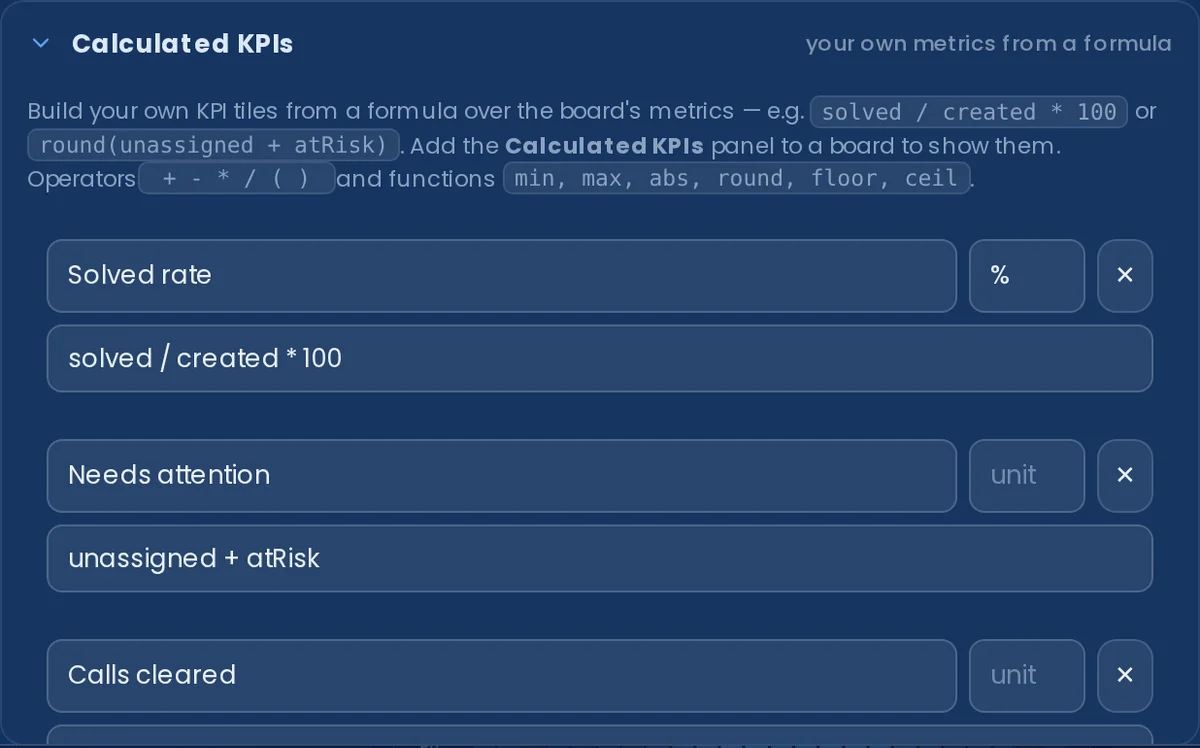
Beyond the built-in panels, Nexus bends to how you work. Build Calculated KPIs from a formula over the board's own figures — a success rate as solved / created * 100, or a single "needs attention" number — checked live as you type and shown in their own panel.
Get alerts on the phone, not just the wall. Point any screen at one team or department. Build branded PDF reports — your logo, per team or per agent — in a couple of clicks. Give everyone their own login, at the right level. Stand up a staff-clock kiosk on a wall tablet — the team taps a face to clock in as in the office, on site or remote. Sign in with Google, Microsoft or your company SSO. Embed a live board in your intranet. And when a tool isn't on the list, point a custom connector at any JSON endpoint you control.
Define your own KPI tiles from a safe formula over the board's metrics — operators and min/max/round…, validated live. No eval, no extra fetches.
Mirror threshold, smart-anomaly and screen-offline alerts to phones — native Android/web (FCM) and iOS (APNs) — so the team is nudged away from the wall too.
A daily PDF of the board — solved, created, CSAT, calls, top solver — rendered and delivered for you, with no mail server on the board.
Build a branded PDF report on demand — your uploaded logo, charts and metrics for the whole desk, one team, one agent or one client (the QBR pack), over any timeframe. AI summary and insights, trends vs last period, SLA, feedback themes and your own notes — assembled in your browser and downloaded on the spot. Save presets, or schedule recurring reports that email themselves and keep an archive of what was sent.
Show one team or department on every screen — presence, leaderboards, CSAT and feedback follow the team you pick in setup or Settings, with a chip on the board so nobody mistakes it for the whole desk.
Clock in and out as On site or Remote, see who's working now, and keep working-time records on your own Nexus server. Managers can help with missed entries; Nexus never asks for GPS.
Named logins instead of one shared passcode, at four levels — viewer, advanced, manager, admin — grouped by team like an org chart. Scrypt-hashed, lockout-protected, and named in the audit trail.
Sign in with Google Workspace or Microsoft 365 — or through your identity-aware reverse proxy — and keep an audit trail of who changed what.
Embed a read-only board in your intranet via an allow-listed iframe, and feed a Custom Data panel from any JSON endpoint you control.
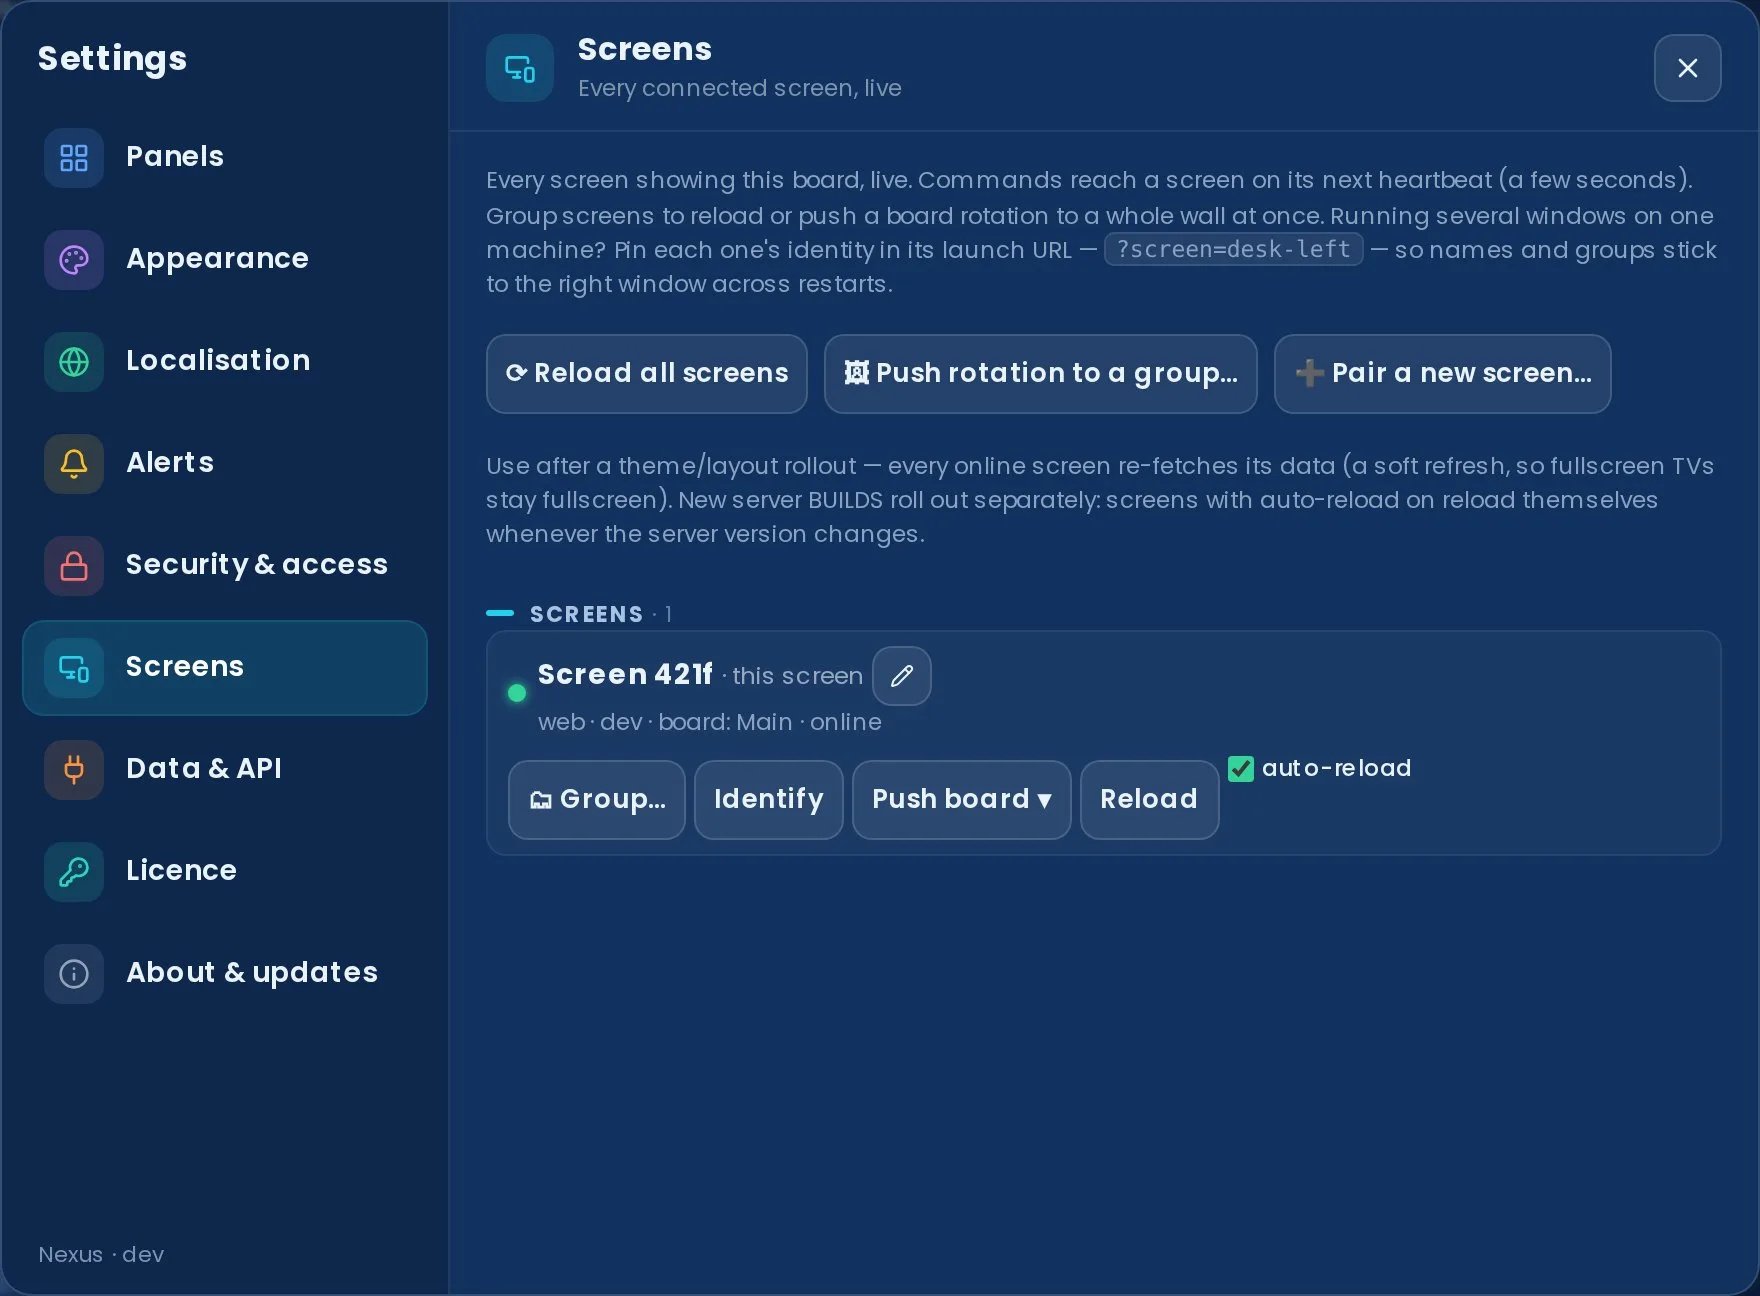
Got Nexus on five TVs, a few desks and someone's phone? Screen Sync (a Pro feature) shows every connected screen live — name, platform, build, what it's showing — and lets you drive them all without leaving your chair.
Identify flashes a badge on a TV so you know which is which, then group them by location. Push the board you're looking at to any view-only screen, or send a whole rotation playlist to a group. Reload one screen, a group, or all of them — and with auto-reload on, screens roll onto a new build by themselves the moment you update the server. No ladder, no USB stick, no walking the floor.
Switchboard matches each unassigned ticket to the right specialist — by area, live availability and load — and can assign it automatically under your rules (dry-run first, full safety rails). It's body-aware, learns each engineer's specialisms from your solved history, and offers optional AI for the tickets keywords can't call. It lives right on the wallboard: a live routing feed with engineer load bars, tap-to-trace and one-tap assign, plus a ready-made Switchboard Command layout.
A first-run wizard gets you live in minutes; everything sensitive is encrypted at rest and your support data never leaves your server.
Self-hosting is the default and stays that way. Would rather not run a server? Managed hosting is an optional add-on — we run your own isolated instance in a UK/EU region — and you can move back to self-hosting whenever you like.
DPAPI / AES-256-GCM
Server-enforced isolation
Ship it your way
Admin tokens & wizard
New to wallboards? Our guides for support teams cover what to put on a wallboard and the SLA metrics that matter.
Explore every panel in demo mode — no account needed — then start a 14-day free trial on your own data, billed only if you keep it.