 Nexus
NexusGuides → Help desk KPIs every support team should track
Help desk KPIs every support team should track
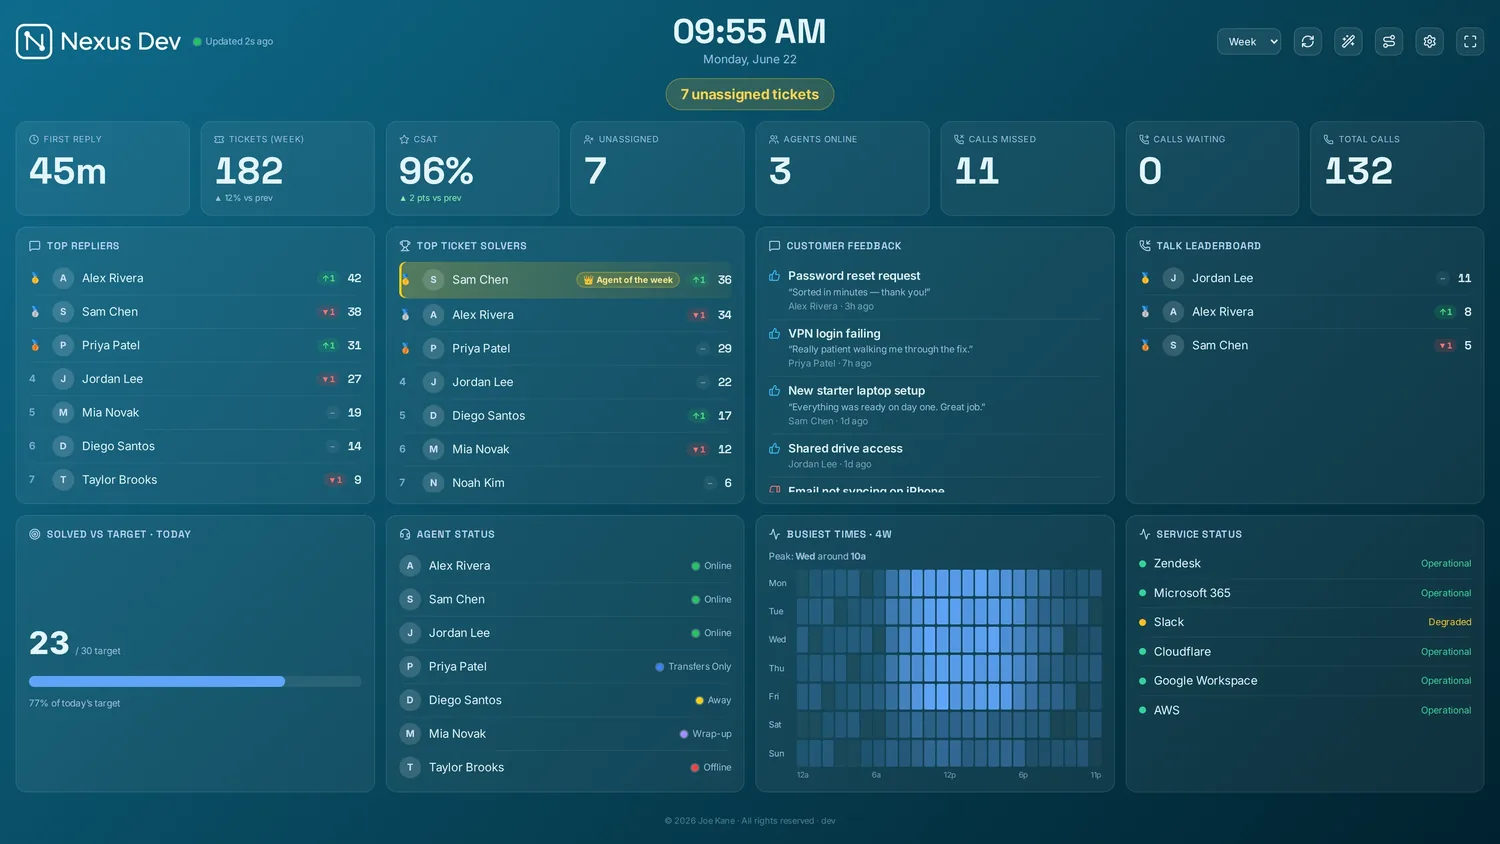
There are dozens of help desk metrics you could chase, but only a handful change how a support team behaves day to day. This is a practical rundown of the KPIs worth tracking — what each one means, what good tends to look like, and whether it belongs on a live wall in front of the team or in your month-end report.
First response time
How long a customer waits for the first human reply. It's the metric customers feel most, because the silence after raising a ticket is when frustration builds. Good looks like minutes on chat and phone, and well inside your SLA target on email — but the right number depends entirely on the promise you've set. Track the median rather than the mean; a couple of slow outliers can drag an average into looking far worse than the typical experience.
Wall or report? Both. The live average for today belongs on the wall as a KPI tile so the team can feel it drifting, but the trend over weeks is a reporting question.
Resolution time
How long from a ticket opening to it being solved. This is the one customers remember after the fact, and the one managers are asked about. Be honest with yourself about what counts as "resolved" — if tickets reopen, your headline resolution time is flattering you. Segment it by priority and by type, because a five-minute password reset and a three-day integration bug averaged together tell you nothing useful.
Wall or report? Mostly report. It moves too slowly to act on in the moment. The exception worth showing live is the oldest open ticket — a single ageing case is usually the real risk hiding behind a healthy average.
SLA attainment
The percentage of tickets answered or resolved inside the target you've committed to. This is the contractual heartbeat of a support desk, and the one number a client or an internal stakeholder will hold you to. Good is consistently above your stated threshold with no nasty surprises; a figure that swings week to week usually means staffing or routing, not effort.
Wall or report? The live version absolutely earns wall space — specifically, tickets about to breach, shown as a countdown that shifts from amber to red so the room can rally before a case slips. The attainment percentage over a month is a report. We go deeper on this split, and on which SLA figures glance well versus which only make sense in a table, in the companion guide on which SLA metrics belong on a wall versus a report.
CSAT
Customer satisfaction, usually a thumbs up/down or a one-to-five score on a solved ticket. It's the counterweight to every speed metric: without it, "close it fast" quietly becomes the only goal. Response rates are always low, so read CSAT as a directional signal rather than a precise gauge, and pay more attention to the comments behind a low score than to a single decimal point of movement.
Wall or report? Both, and worth showing per agent on the wall so quality stays visible next to throughput.
Backlog and unassigned
Two related but distinct numbers. Backlog is everything still open; unassigned is the slice that is nobody's yet. Unassigned is the more actionable of the pair, because it's the queue anyone free can clear immediately. A healthy desk keeps unassigned close to zero during staffed hours; a growing backlog with low unassigned usually means tickets are owned but stuck, which is a different conversation.
Wall or report? Wall, firmly. Seeing the open and unassigned counts climb is exactly the kind of thing that makes an available agent pick up the next ticket.
Ticket volume
How many tickets are coming in, by day, channel and type. On its own it's context rather than a target — volume going up isn't good or bad until you know whether you've the capacity for it. Its real value is spotting patterns: a spike after a release, a recurring Monday-morning surge, a channel quietly taking over. That's what lets you staff and deflect intelligently.
Wall or report? A simple "tickets today versus target" progress bar works nicely on the wall and gives the team something to chase. The volume trends, seasonality and channel-mix analysis belong in reporting, where you can actually slice them.
Reopen rate
The share of solved tickets that come back. It's the quiet quality killer — a desk can post fast resolution times by closing tickets prematurely, and the reopen rate is where that shows up. Anything creeping above a few per cent is worth investigating; it usually points at a knowledge gap, a recurring product issue, or pressure to close at the expense of actually fixing things.
Wall or report? Report. It's a coaching and process metric, not something anyone acts on mid-shift.
First contact resolution
The proportion of tickets sorted in a single interaction, with no back-and-forth. High FCR correlates strongly with satisfaction and with lower cost per ticket, because every reopen and follow-up is effort the customer didn't ask for. It's also one of the harder numbers to measure cleanly, so define it carefully and apply it consistently rather than obsessing over the absolute figure.
Wall or report? Report. Like reopen rate, it's a trend you review, not a live signal.
The test for the wall: a metric earns wall space only if seeing it change makes someone act in the next few minutes. Everything else — however important — is a report metric. Mixing the two is the fastest way to make a board people stop looking at.
Putting it on a board
Most of these can be tracked from whatever help desk you already run — Nexus pulls them from one ticketing provider at a time (Zendesk, Freshdesk, Freshservice, Jira Service Management, HaloPSA and more) and turns the live-worthy ones into KPI tiles, SLA breach countdowns, leaderboards and CSAT panels on a self-hosted board you can put on a TV. If you run phone support through Zendesk Talk, a live call queue sits alongside them. You can see the full set on the features page, and if you're on Zendesk specifically the Zendesk wallboard page shows exactly how these tiles map across.
The quickest way to judge which of these KPIs actually reads well at a glance is to look at them on a real board, so try the zero-setup live demo — it runs with sample data, no account and no card needed.
See it live
Nexus puts SLA countdowns, the live queue, CSAT and leaderboards on a self-hosted board — try the demo (no account, no card), then start a 14-day free trial on your own data, billed only if you keep it.