 Nexus
NexusGuides → Call centre metrics explained: service level, ASA, abandonment & AHT
Call centre metrics explained: service level, ASA, abandonment & AHT
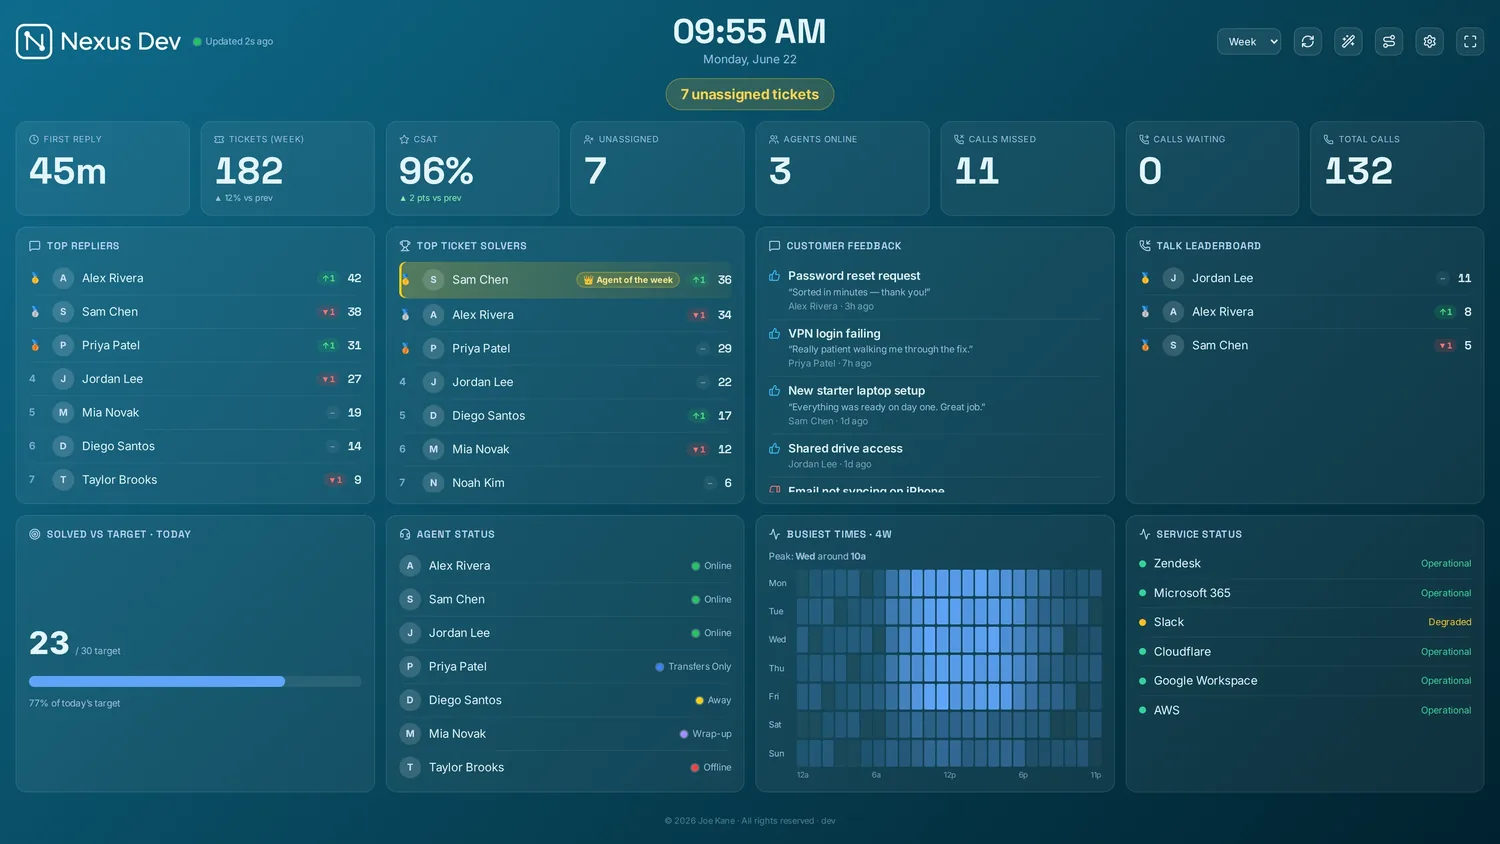
Call-centre metrics sound technical, but most of them answer one plain question: is the queue under control, and if not, how badly? This guide explains the core ones — service level, ASA, abandonment, AHT, calls waiting, longest wait and occupancy — what each really measures, what a healthy number looks like, and which deserve a spot on a live wall the floor can act on.
The headline number: service level
Service level is the percentage of calls answered within a target time, written as a pair: the classic is 80/20 — 80% of calls answered within 20 seconds. It's the figure most managers judge the day on, because it captures the promise you've made to callers in a single, honest number. Pick a target that matches your callers' patience, not an arbitrary industry figure: a software support line and an emergency desk have very different reasonable waits.
What good looks like depends entirely on that promise. 80/20 is a common baseline; some teams run tighter (90/15), many run looser and are perfectly fine with it. The trap is chasing a service level so high it forces overstaffing — past a point, each extra percentage point costs far more than it's worth. Set it deliberately, then watch it live.
ASA — average speed of answer
ASA is the mean time a caller waits before an agent picks up, measured across answered calls. It's intuitive and easy to report, but it has the weakness of every average: it hides the tail. A handful of callers stuck for several minutes can sit behind a comfortable-looking ASA, because the many quick answers drag the mean down. That's why ASA is better as a trend line in a report than as the single number on a wall — pair it with longest wait, below, which exposes exactly what the average smooths over.
Abandonment rate
Abandonment is the share of callers who hang up before anyone answers. It is the truest cost of a queue, because it's measured in people who gave up. A rising abandonment rate usually means waits have crossed the line from annoying to intolerable, and it tends to move with longest wait and service level — when those slip, abandonment follows.
One honest caveat: very short abandons (someone who dials, then thinks better of it within a couple of seconds) aren't really failed service, and many teams exclude them with a short-abandon threshold so the number reflects genuine give-ups. However you define it, keep the definition consistent — an abandonment rate you can't compare week to week isn't telling you anything.
AHT — average handle time
AHT is how long an agent spends per call from answer to finish, including talk time and after-call wrap. It's the metric most often misused. High AHT isn't automatically bad — a complex line should have a higher one — and pushing it down hard tends to bounce straight back as repeat calls and worse CSAT. Treat AHT as capacity-planning context, not a stick: it tells you roughly how many agents you need to clear a given volume, and it changes slowly. That makes it a poor fit for the fastest-moving part of a wall and a good fit for a report or a slowly-updating tile.
Occupancy, calls waiting and longest wait
- Occupancy is the proportion of logged-in time agents spend actually handling calls (talk plus wrap) versus available-but-idle. It's a staffing and wellbeing gauge: sustained high occupancy — say above the mid-80s — means people have no breathing room between calls, and burnout and errors climb. Like AHT, it's context, not a live alarm.
- Calls waiting is the heartbeat of the floor — how many people are in the queue right now. One big number; when it climbs, available agents pick up. This is a live-wall metric in its purest form.
- Longest wait is how long the most-stuck caller has been holding. It's the number that exposes the individual being failed while the average looks fine — show it, and turn it amber then red past your threshold.
Which of these belong on a live wall
The test for a wallboard is simple: can the team do something about this number in the next few minutes? By that test, the live trio — calls waiting, longest wait and service level — earn the biggest tiles. Abandonment and a calls-handled leaderboard add useful context. AHT and occupancy are slow-moving capacity metrics: keep them small, or keep them in a report. We go deeper on the layout in our guide to what to put on a call centre wallboard, and on the page for the call centre wallboard itself.
Be clear about what Nexus reads. Nexus shows a live call queue for Zendesk via Zendesk Talk — calls waiting, longest wait and agents on calls, refreshed roughly every 20 seconds. It is a wallboard, not a full ACD or PBX: it doesn't replace your phone platform's own reporting for deep historical service-level, ASA, occupancy or abandonment analysis. It puts the handful of live numbers the floor needs in front of everyone, in real time.
Putting it together
The metrics work as a set, not in isolation. Service level tells you whether you're keeping your promise; calls waiting and longest wait tell you, live, where it's about to break; abandonment confirms the cost when it does; AHT and occupancy explain whether you have the capacity to fix it. Choose targets that fit your callers, watch the live three on the wall, and leave the slow-moving averages to your reports.
The best way to see how the live numbers feel in practice is to watch them move. Our live demo runs a full board with sample data — no account, no card — so you can judge what reads well from across a room before deciding what your own floor should show.
See it live
Nexus puts SLA countdowns, the live queue, CSAT and leaderboards on a self-hosted board — try the demo (no account, no card), then start a 14-day free trial on your own data, billed only if you keep it.